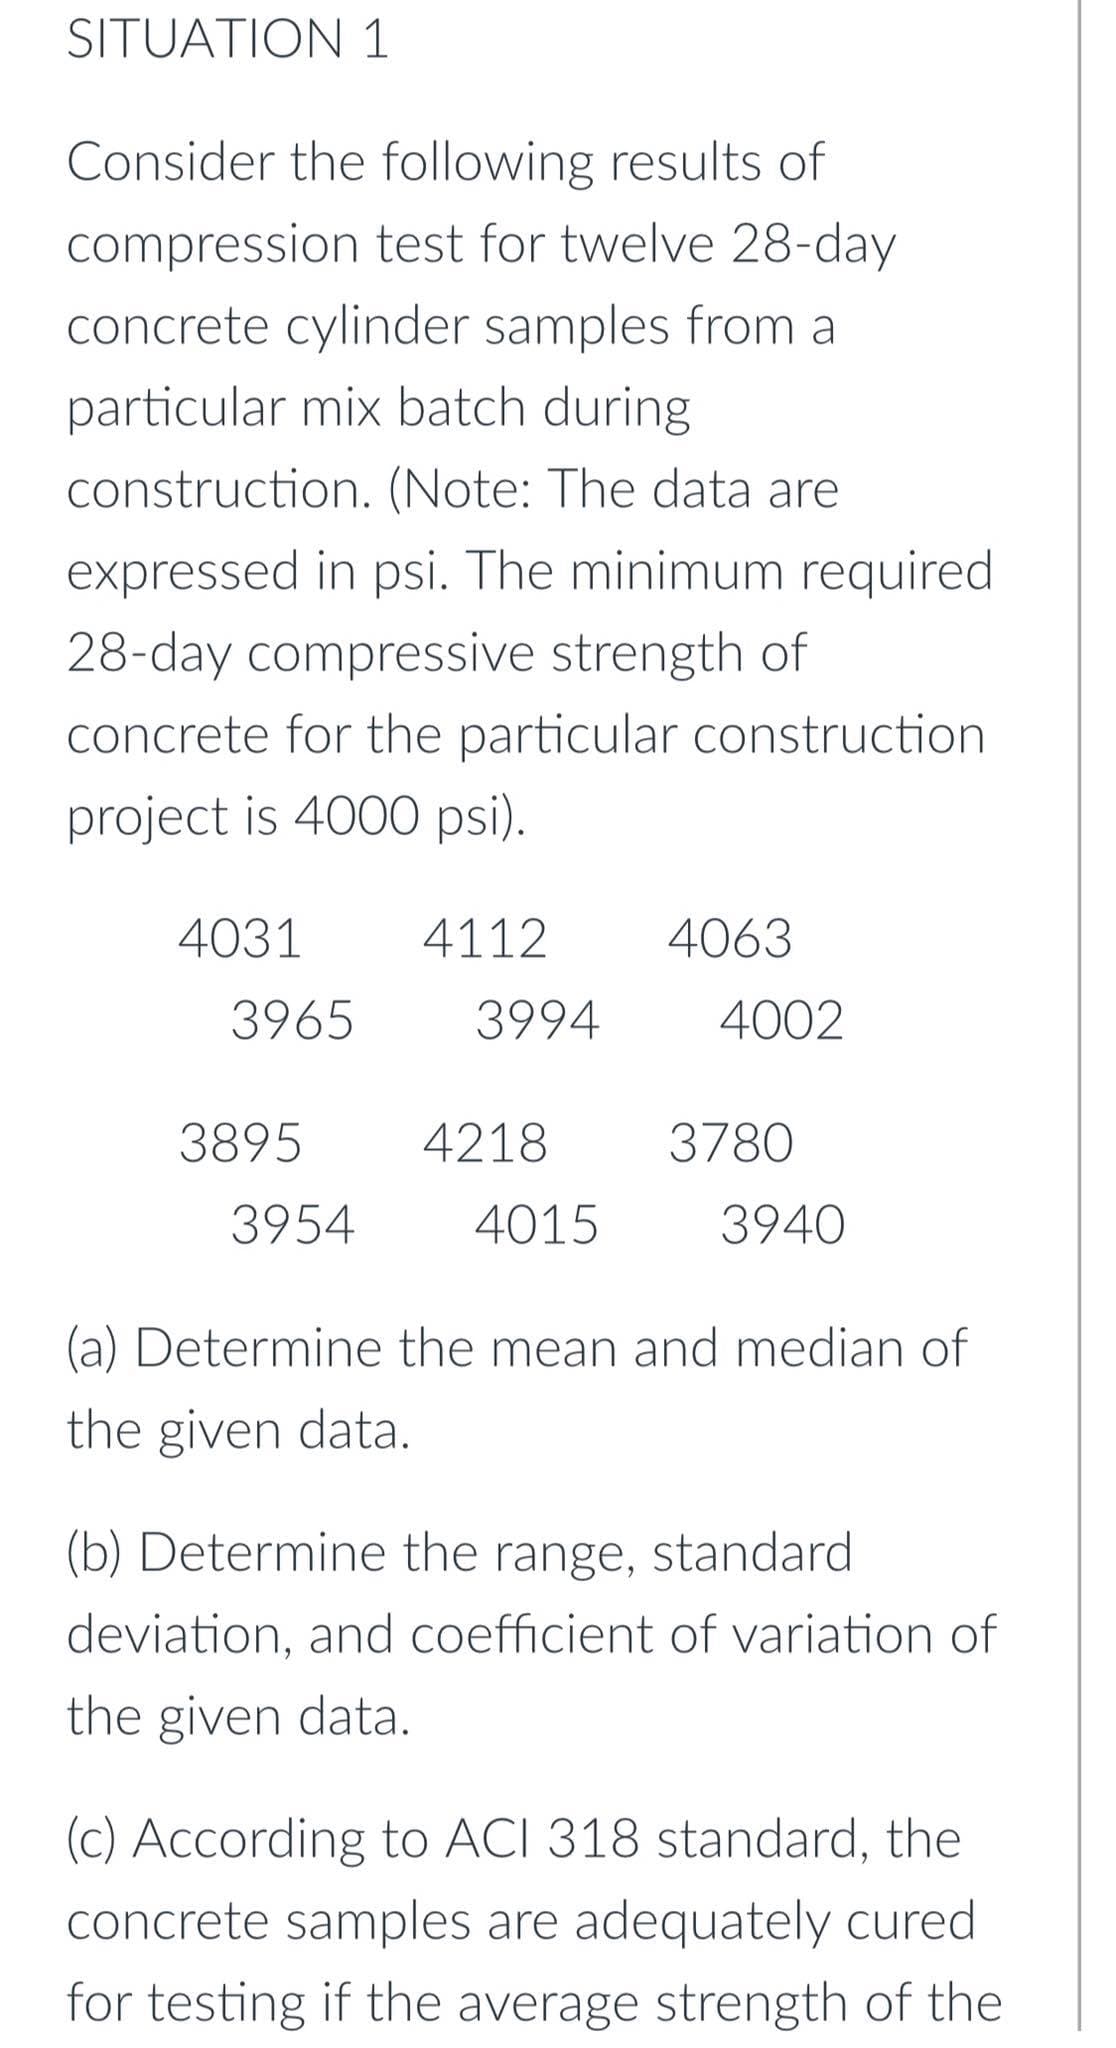
Consider the following results of compression test for twelve 28-day concrete cylinder samples from a particular mix batch during ostruction (Note: Th e data are on


Q: The null hypothesis is a statement about the A) population parameter B) sample statistics C) sample ...
A:
Q: A research center claims that 31% of adults in a certain country would travel into space on a commer...
A:
Q: 1. In an aptitude test given to a group of 200 applicants, the average score was 75 and the standard...
A: I solved exactly first question because of bartleby policy if you want more please upload separately...
Q: The recovery room or the post anesthesia care area at St. Luke’s Hospital in Maumee, Ohio, was recen...
A: By using calculator
Q: The world bank reports that one. 7% of the US population lives unless than two dollars per day. A po...
A: From the given information above we have The world bank reports that 1.7% of the US population lives...
Q: A research center claims that at least 31% of adults in a certain country think that their taxes wil...
A: Given Sample size, n=900Sample proportion, p^=0.26α=0.05
Q: An education researcher dlaims that at most 7% of working college students are employed as teachers ...
A: Given,sample size(n)=500sample proportion(p^)=0.09α=0.01
Q: Illustration. 20.25. Two investigators study the income of a group of persons by the method of sampl...
A:
Q: Consider an . netigator was interested in the average price of a house in a certain region. They col...
A: Hi! Thank you for the question, As per the honor code, we are allowed to answer three sub-parts at a...
Q: State null and alternative hypotheses. Report results of statistical test, i.e., significant or not...
A: Given: 53,57,61,49,52,56, 58, 62, 51, 56 μ=52α=0.05
Q: obtain the value of b. regaring e conomethies and the forme 4= bo t bi Xi Y=bot bixitei
A: For the given linear regression line and its estimate: Y = b0 + b1Xi + ei y^ = b0 + b1 Xi We need to...
Q: The probability that the San Jose Sharks will win any given game is 0.3694 based on a 13-year win hi...
A: Given,n=12p=0.3694Let X=number of games won in November 2005.X~Binomial(n=12 , p=0.3694)P(X=x)=12x0....
Q: Calculate the sample mean, standard deviation, and skewness.
A: Given that The data are 8.5,12.4,7.5,13.6,10.3,9.6,8.2,7.9,6.4,7.8,8.0,10.1,9.3
Q: Two professors at a local college developed a new teaching curriculum designed to increase students'...
A: The given hypothesized proportion is 0.49.
Q: A manufacturer ships toasters in cartons of 10. In each carton, they estimate a 30% chance that ...
A: Let X be the random variable from binomial distribution with probability (p)= 10% = 0.10 and sample ...
Q: six, you you roll a one, two, or three, you pay $6. O Part (a) What are you ultimately interested in...
A: For the given data select the correct choice in part(a )(b )&(c )
Q: A treatment against breast cancer produces an improvement in 80% of the patients to whom it is appli...
A:
Q: Use the following frequency distribution to answer questions: Class Limit 40 - 50 51 - 61 61 - ...
A: Given
Q: The probability you reject the null hypothesis when in fact the null hypothesis is true is called А)...
A: We have given that the statement about to the type of error. Here, we need to find out the correct t...
Q: Suppose that X,~ N(u, oʻ), i = 1,..., n are independent. State the distribution of each of the follo...
A: Hello! As you have posted more than 3 sub parts, we are answering the first 3 sub-parts. In case yo...
Q: Which of the following statements about the median is not true? A. It is less affected by extreme va...
A: Introduction: It is required to identify the statement about the median that is not true.
Q: 3. Which of the following statistics cannot be determined from a box-and-whisker plot? A. Standard d...
A: 3. Box plot is a graphical representation of a continuous data.
Q: • Interquartile range IQR = Qs – Q1 = 1.58 – 1.36 = 0.22 a. For male students • Mean = 1.457143 20.4...
A: Consider the provided box plot. The vertical straight line in the box of a box plot essentially rep...
Q: A pharmaceutical company is running tests to see how well its new drug lowers cholesterol. Fourteen ...
A: d = Initial level - level after 3 months
Q: The proportion, po, of foraging bumblebees not exposed to pesticides who bring very little pollen ba...
A: Given: sample of 60 bumblebees(n)=60 39 bumblebees brought back vey little pollen to their nest (x)=...
Q: At a certain hospital a doctor wanted to calculate a confidence interval for the birth weights of ne...
A:
Q: Heights of 130 singers in the NY Choral Society in 1979 were self-reported to the nearest inch. The ...
A: The objective is to choose applicable option to use assumption of equal variances about SD is close ...
Q: According to a study conducted by a statistical organization, the proportion of people who are satis...
A: Since both the conditions are satisfied this implies that the sampling distribution of proportion is...
Q: Perform Dixon’s Q-test and Grubb’s test for the following set of data points. Make a conclusion to r...
A: In the given case, the decision rule is if test statistic is greater than the critical value, reject...
Q: Two professors at a local college developed a new teaching curriculum designed to increase students'...
A: Given data in a typical development math course 49% of the students complete the course with a lett...
Q: After observing that the average daily sale was only 12 units alongside with standard deviation of 4...
A: We have given that Sample size n =25 Sample mean =15 Population standard deviation =4
Q: Decide whether the normal sampling distribution can be used. If it can be used, test the claim about...
A:
Q: Decide whether the normal sampling distribution can be used. If it can be used, test the claim about...
A:
Q: Scores on a standardized exam are known to follow a normal distribution with standard deviation σσ =...
A:
Q: 3) Draw a Frequency Polygon, label clea horizontal axis, and draw the graph
A: Frequency Distribution Table A frequency distribution is a chart or table that shows how often possi...
Q: Let the random variable X represent the number of aces observed . Compute the probability Pr * (X = ...
A: Given: 5 cards dealt on table x: number of aces observed
Q: How do you calculate dfAxB for a two-factor ANOVA?
A: Consider a two-factor ANOVA model with factor A and factor B.
Q: The Procrastination Log (PL)…was administered both at intake [pretest to a one-hour individual couns...
A: The group means and SD of intake and outtake of procrastination log scores are given.
Q: Which of the following statistics is not a measure of central tendency A. Mean B. Median C. Mode D. ...
A: A representative observation of the central part of the data is known as measure of central tendency...
Q: the bin nypotnesis test. First determine the P-value. P-value = (Round to three decimal places as ne...
A: We have given that Population proportion p=49%=0.49 Sample size n=17 Favorable cases x =12 Sample p...
Q: 1. Suppose you want to construct a confidence interval for a population proportion. Which of the fol...
A:
Q: A bin of 50 parts contains 5 that are defective. A sample of 10 parts is selected at random, without...
A:
Q: Using the .01 significance level, can we conclude that more than 25 is the mean number of patients p...
A: Here The recovery room or the post anesthesia care area at St. Luke’s Hospital in Maumee, Ohio, was ...
Q: Let X be a random variable with moment generating function M(t), and let Y= ax+b. Prove that the mom...
A: Solution-: Let, X- be the random variable with MGF M(t) Let, Y=ax+b We prove that, M(t)=ebt*M(at)
Q: Consider an. netigator was interested in the average price of a house in a certain region. They coll...
A: Hi! Thank you for the question, As per the honor code, we are allowed to answer three sub-parts at a...
Q: Assume the random variable X is normally distributed, with mean u = 45 and standard deviation o = 7....
A:
Q: Q2. A box contains eight yellow, three white and nine blue balls. If three balls are drawn at random...
A: I solved exactly first three subparts because of bartleby policy if you want more please upload sepa...
Q: Q1. Sixteen red balls have numbers from 1 to 16. If a ball is drawn at random, find: 1- probability ...
A:
Q: c) P(z > 1.04) = d) P(z = 1.04) =
A:
Q: Find the mean, mode, median and standard deviation, variance, frequency histogram and cumulative per...
A:

Step by step
Solved in 3 steps

- Problem 5You’re a civil engineer testing the compressive strength of concrete to be used in bridgeconstruction. You test 16 concrete specimens, the resulting in the following compressivestrengths (in psi). DATA:2223 2329 2269 2244 2258 2325 2204 22962316 2272 2302 2342 2307 2205 2208 2311 a. Is the mean compressive strength greater than 2200 psi? Use the critical value approachand the appropriate table with 95% confidence.b. Is the mean compressive strength greater than 2200 psi? Use the p-value approach andExcel with 95% confidence.c. Is the standard deviation of compressive strength less than 50 psi? Use the critical valueapproach with 95% confidence.The determination of the shear strength of spot welds is relatively difficult, whereas measuring the weld diameter of spot welds is relatively simple. As a result, it would be advantageous if shear strength could be predicted from a measurement of weld diameter. The data are as follows: Shear strength (psi) Weld diameter (0.0001 in) 370 400 780 800 1210 1250 1560 1600 1980 2000 2450 2500 3070 3100 3550 3600 3940 4000 3950 4000 a) Test the hypothesis that the slope of the regression line is equal to 1 at the 0.05 level of significance.A crayon manufacturer is comparing the effects of two kinds of yellow dye on the brittleness of crayons. Dye B is more expensive than dye A, but it is thought that it might produce a stronger crayon. Four crayons are tested with each kind of dye, and the impact strength (in joules) is measured for each. The results are as follows: Dye A: 1.0 2.0 1.2 3.0 Dye B: 3.0 3.2 2.6 3.4 a) Can you conclude that the mean strength of crayons made with dye B is greater than that of crayons made with dye A? b) Can you conclude that the mean strength of crayons made with dye B exceeds that of crayons made with dye A by more than 1 J?
- An article in the ASCE Journal of Energy Engineering [“Overview of Reservoir Release Improvements at 20 TVA Dams” (Vol. 125, April 1999, pp. 1–17)] presents data on dissolved oxygen concentrations in streams below 20 dams in the Tennessee Valley Authority system. The observations are (in milligrams per liter):The compressive strength of concrete is being studied, and four different mixing techniques are being investigated. The following data have been collected. Mixing Technique Compressive Strength (psi) Observations 1 3129 3000 2865 2890 2 3200 3300 2975 3150 3 2800 2900 2985 3050 4 2600 2700 2600 2765 (a) Test the hypothesis that mixing techniques affect the strength of concrete. Use α=0.05. Calculate to 2 decimal places f0: Does mixing technique affect concrete strength? (b) Find to 2 decimal places the P-value for the F-statistic computed in part (a). P-value = (c) Analyze the following residual plots to determine model adequacy. Does the assumption of normality seem reasonable? Does the assumption of constant variance seem reasonable?QUESTION 6 A new starch polymer foam with high shock absorbent properties is expected to perform better thanthe old foam which can withstand a maximum impact of 1.56 Joule (J). A simple destructive testto quantify shock absorption ability of the new foam is conducted. Table 5 shows the impact energyabsorbed (in J) that the new foam can withstand for each test.Table 51.61 1.5 1.65 1.7 1.4 1.59 1.65 1.5Does the recorded data suggests that the new foam performs better than the old foam? Use 2.5%level of significance.
- PART D ONLY We are using the average bonuses paid to workers on Wall Street from 2000 to 2016 to fit different auto-regressive models. The data is provided below: Year Bonus($000) 2000 100.5 2001 74.1 2002 60.9 2003 99.9 2004 113.5 2005 149.8 2006 191.4 2007 177.8 2008 100.9 2009 140.6 2010 139.0 2011 111.4 2012 142.9 2013 169.8 2014 160.3 2015 136.8 2016 138.2 a. fit a third-order autoregressive model to the bonuses paid and test for the significance of the third-order autoregressive parameter (slope) (Use a = 0.05.) b. if necessary, fit a second-order autoregressive model to the bonuses paid and test for the significance of the second-order autoregressive parameter (slope). (Use a = 0.05.) c. if necessary, fit a first-order autoregressive model to the bonuses paid and test for the significance of the first-order autoregressive parameter (slope). (Use a =…Two different chemical formulations of rocket fuel are considered for the peak thrust they deliver in a particular design for a rocket engine. The thrust/weight ratios (in kilograms force per gram) for each of the two fuels are measured several times. The results are as follows: Fuel A 54.1 52.9 57.9 58.2 53.4 51.4 56.8 55.9 57.9 56.8 58.4 52.9 55.5 51.3 51.8 53.3 Fuel B 55.1 55.5 53.1 50.5 49.7 50.1 52.4 54.4 54.1 55.6 56.1 54.8 48.4 48.3 55.5 54.7 A.Find the P-value. B.Can you conclude at the 5% level that the switch to fuel A should be made?Below you are given a partial Excel output based on a sample of 16 observations. ANOVA df SS MS F Regression 4,853 2,426.5 Residual 485.3 [row intentionally left blank] Coefficients Standard Error Intercept 12.924 4.425 x1 -3.682 2.630 x2 45.216 12.560 Refer to Exhibit 3. We want to test whether the parameter β1 is significant. The test statistic equals: Select one: a. 5 b. 1.4 c. -1.4 d. 3.6
- The data given below indicate the existence of a linear relationship between the x and y variables. Suppose an analyst who prepared the solutions and carried out the RI measurements was not skilled and as a result of poor technique, allowed intermediate errors to appear. The results are the following:Concentration of solution in percent (x) 10 26 33 50 61Refractive indices (y) 1.497 1.493 1.485 1.478 1.477Step 1. Carefully plot the given x and y values (from the table) on a regular graphing paper. Label then connect the points to observe a zigzag plot due to the scattered points. Step 2: Copy and fill the table given below: x (x - x̄) (x - x̄) 2 y (y - ȳ) (y - ȳ) 2 (x - x̄) (y - ȳ) 10 1.497 26 1.49333 1.48550 1.47861 1.477∑ = ∑ = ∑ = ∑ = ∑ = ∑ = ∑ =x̄= ∑xi ÷ Nx̄= ȳ = ∑yi ÷ Nȳ = Step 3. After completing the table, present following computations and the interpretation.a. Calculate the correlation coefficient (r), using the working formula: r =Σ (x − x ) (y − ȳ)√(Σ(x − x )2)(Σ(y −…Samples are collected from the River X and pH values are observed. 9 different pH values are listed in table 3. Table 3 Concentrations 3.55 4.01 5.38 3.22 8.05 5.25 4.67 3.67 3.5Draw box plot and find a. Bowley’s coefficient of skewness b. Karl Pearson’s coefficient of skewness c. Third moment Rubric Stages of Process Marks Imagine and Plan 2Composition 2Effort 1) The following table shows 10 communities ranked by decayed, missing, or filled (DMF) teeth per 100 children and fluoride concentration in ppm in the public water supply: Rank by DMF Teeth FluorideCommunity per 100 children X Concentration Y 1 8 1 2 9 3 3 7 4 4 3 9 5 2 8 6 4 77 1…