Consider the following set of dependent and independent variables. Using technology, check 1or ihe presen necessary steps to eliminate it. 33 20 24 39 8. 10 13 16 19 23 28 41 11 16 20 16 10 13 10 8. 7 4. 8. 15 6. 12 18 17 23 20 27 29
Consider the following set of dependent and independent variables. Using technology, check 1or ihe presen necessary steps to eliminate it. 33 20 24 39 8. 10 13 16 19 23 28 41 11 16 20 16 10 13 10 8. 7 4. 8. 15 6. 12 18 17 23 20 27 29

MATLAB: An Introduction with Applications
6th Edition
ISBN:9781119256830
Author:Amos Gilat
Publisher:Amos Gilat
Chapter1: Starting With Matlab
Section: Chapter Questions
Problem 1P

Related questions
Question
NEED FULLY CORRECT HANDWRITTEN SOLUTION FOR THIS....
ASAP!!!!
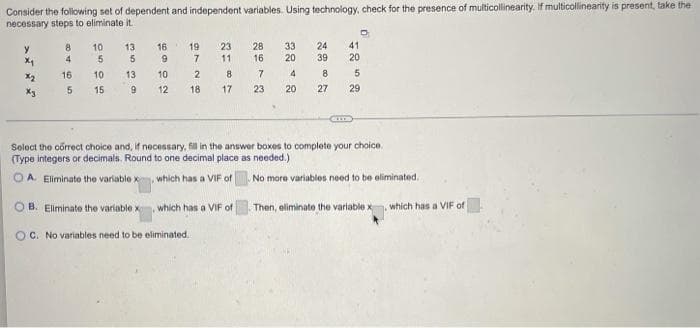
Transcribed Image Text:Consider the following set of dependent and independent variables. Using technology, check for the presence of multicollinearity. If multicollinearity is present, take the
necessary steps to eliminate it
41
20
23
28
16
y
8
10
13
16
19
33
24
4.
11
20
39
16
10
13
10
2
8
8
5
15
12
18
17
23
20
27
29
X3
Soloct the corrct choice and, if necessary, fill in the answer boxes to complete your choice.
(Type integers or decimals. Round to one decimal place as needed.)
OA. Eliminate the variable x, which has a VIF of
No more variables need to be eliminated.
O B. Eliminate the variable x, which has a VIF of
Then, eliminate the variable x
which has a VIF of
O C. No variables need to be eliminated.
Expert Solution
This question has been solved!
Explore an expertly crafted, step-by-step solution for a thorough understanding of key concepts.

Step by step
Solved in 4 steps with 12 images

Recommended textbooks for you
MATLAB: An Introduction with Applications
Statistics
ISBN:
9781119256830
Author:
Amos Gilat
Publisher:
John Wiley & Sons Inc

Probability and Statistics for Engineering and th…
Statistics
ISBN:
9781305251809
Author:
Jay L. Devore
Publisher:
Cengage Learning

Statistics for The Behavioral Sciences (MindTap C…
Statistics
ISBN:
9781305504912
Author:
Frederick J Gravetter, Larry B. Wallnau
Publisher:
Cengage Learning
MATLAB: An Introduction with Applications
Statistics
ISBN:
9781119256830
Author:
Amos Gilat
Publisher:
John Wiley & Sons Inc
Probability and Statistics for Engineering and th…
Statistics
ISBN:
9781305251809
Author:
Jay L. Devore
Publisher:
Cengage Learning
Statistics for The Behavioral Sciences (MindTap C…
Statistics
ISBN:
9781305504912
Author:
Frederick J Gravetter, Larry B. Wallnau
Publisher:
Cengage Learning

Elementary Statistics: Picturing the World (7th E…
Statistics
ISBN:
9780134683416
Author:
Ron Larson, Betsy Farber
Publisher:
PEARSON

The Basic Practice of Statistics
Statistics
ISBN:
9781319042578
Author:
David S. Moore, William I. Notz, Michael A. Fligner
Publisher:
W. H. Freeman

Introduction to the Practice of Statistics
Statistics
ISBN:
9781319013387
Author:
David S. Moore, George P. McCabe, Bruce A. Craig
Publisher:
W. H. Freeman