Consider the function Y=5X0520s, where X and Z are both greater than or equal to zera. Complete the following table by calculating the value of Y for each set of values for X and Z. XZ Y 4 16 6 6 16 4 16 1 18 1 4 4 1 16 8 2 Use the blue curve (circle symbols) to graph the values from the previous table that correspond to the contour line when Y=20. Use the green curve (triangle symbols) to graph the values from the previous table that correspond to the contour line when Y 30. Finally, use the purple curve (diamond symbols) to graph the values from the previous table that correspond to the contour fine when Y = 40. 20 18 16 14 12 N 10 B 6 4 8 2 10 12 X 14 10 10 20 kkk Contour Line Y=20 Contour Line Y 30 Contour Line Y 40
Consider the function Y=5X0520s, where X and Z are both greater than or equal to zera. Complete the following table by calculating the value of Y for each set of values for X and Z. XZ Y 4 16 6 6 16 4 16 1 18 1 4 4 1 16 8 2 Use the blue curve (circle symbols) to graph the values from the previous table that correspond to the contour line when Y=20. Use the green curve (triangle symbols) to graph the values from the previous table that correspond to the contour line when Y 30. Finally, use the purple curve (diamond symbols) to graph the values from the previous table that correspond to the contour fine when Y = 40. 20 18 16 14 12 N 10 B 6 4 8 2 10 12 X 14 10 10 20 kkk Contour Line Y=20 Contour Line Y 30 Contour Line Y 40

Macroeconomics: Principles and Policy (MindTap Course List)
13th Edition
ISBN:9781305280601
Author:William J. Baumol, Alan S. Blinder
Publisher:William J. Baumol, Alan S. Blinder
Chapter1: What Is Economics
Section1.A: Using Graphs: A Review
Problem 1TY

Related questions
Question
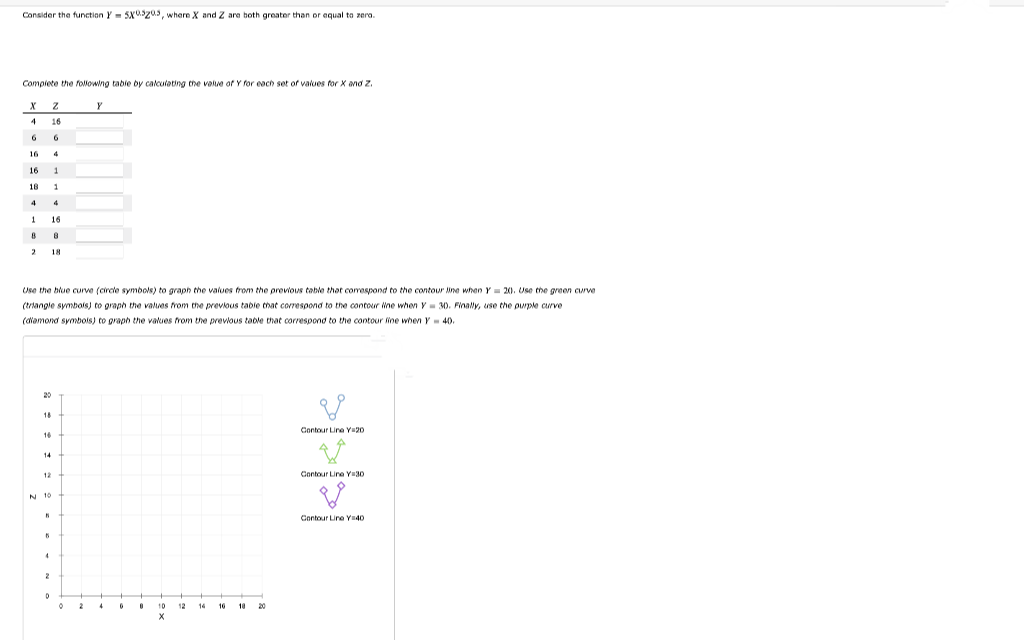
Transcribed Image Text:Consider the function Y5X03203, where X and Z are both greater than or equal to zero.
Complete the following table by calculating the value of Y for each set of values for X and Z.
X
16
18
1
8
20
16
14
N 10
6
Use the blue curve (circle symbols) to graph the values from the previous table that correspond to the contour line when Y=20. Use the green curve
(triangle symbols) to graph the values from the previous table that correspond to the contour line when ya 30. Finally, use the purple curve
(diamond symbols) to graph the values from the previous table that correspond to the contour line when y=40.
5
4
2
z
16
6
D
4
1
1
16
8
18
Y
0
0
10
X
12
14
10 10
20
Contour Line Y 20
N
Contour Line Y 30
B
Contour Line Y 40
Expert Solution
This question has been solved!
Explore an expertly crafted, step-by-step solution for a thorough understanding of key concepts.

Step by step
Solved in 3 steps with 1 images

Recommended textbooks for you
Macroeconomics: Principles and Policy (MindTap Co…
Economics
ISBN:
9781305280601
Author:
William J. Baumol, Alan S. Blinder
Publisher:
Cengage Learning


Macroeconomics: Principles and Policy (MindTap Co…
Economics
ISBN:
9781305280601
Author:
William J. Baumol, Alan S. Blinder
Publisher:
Cengage Learning


