Consider the hypotheses below. H0 u = 50. H0 u≠ 50 Given that x= 53, s= 20, n= 25, and a= 0.05, answer the questions below. a) what conclusions should be drawn b) use technology to determine the p value for this test Please help i am having trouble and keep getting it wrong
Consider the hypotheses below. H0 u = 50. H0 u≠ 50 Given that x= 53, s= 20, n= 25, and a= 0.05, answer the questions below. a) what conclusions should be drawn b) use technology to determine the p value for this test Please help i am having trouble and keep getting it wrong

Algebra & Trigonometry with Analytic Geometry
13th Edition
ISBN:9781133382119
Author:Swokowski
Publisher:Swokowski
Chapter5: Inverse, Exponential, And Logarithmic Functions
Section5.6: Exponential And Logarithmic Equations
Problem 64E

Related questions

Topic Video
Question
Consider the hypotheses below.
H0 u = 50. H0 u≠ 50
Given that x= 53, s= 20, n= 25, and a= 0.05, answer the questions below.
a) what conclusions should be drawn
b) use technology to determine the p value for this test
Please help i am having trouble and keep getting it wrong !
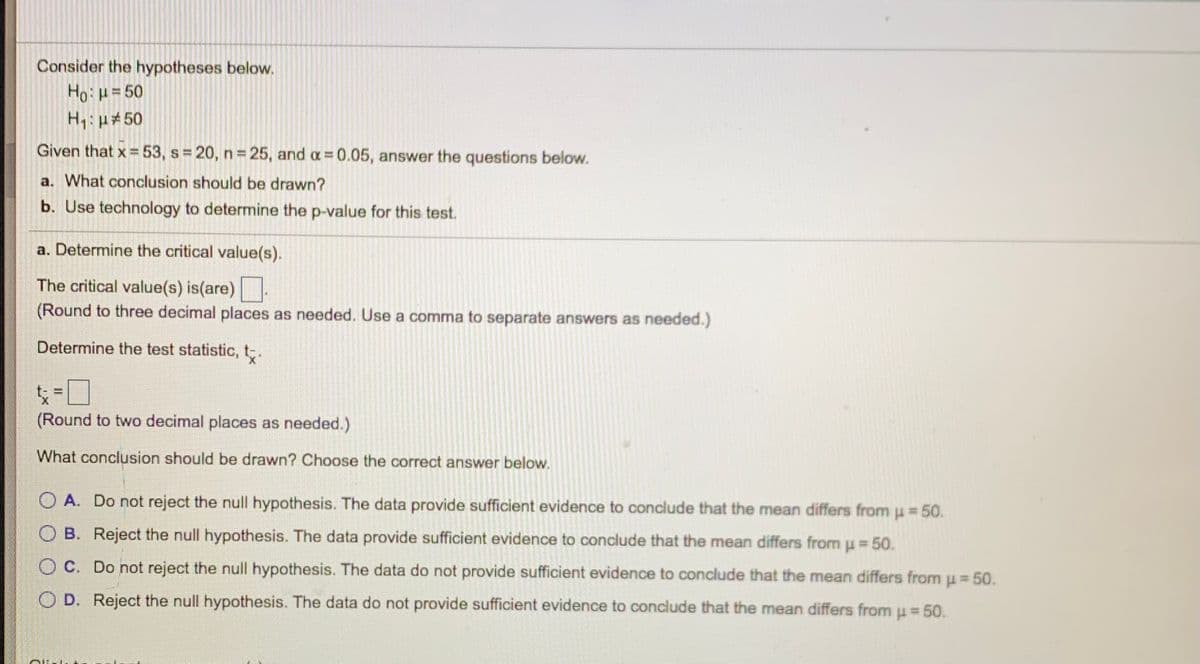
Transcribed Image Text:Consider the hypotheses below.
Ho=50
H1: p#50
Given that x = 53, s 20, n 25, and a 0.05, answer the questions below.
a. What conclusion should be drawn?
b. Use technology to determine the p-value for this test.
a. Determine the critical value(s).
The critical value(s) is(are).
(Round to three decimal places as needed. Use a comma to separate answers as needed.)
Determine the test statistic, t.
%3D
(Round to two decimal places as needed.)
What conclusion should be drawn? Choose the correct answer below.
O A. Do not reject the null hypothesis. The data provide sufficient evidence to conclude that the mean differs from u = 50.
%3D
O B. Reject the null hypothesis. The data provide sufficient evidence to conclude that the mean differs from u 50.
O C. Do not reject the null hypothesis. The data do not provide sufficient evidence to conclude that the mean differs from u = 50.
O D. Reject the null hypothesis. The data do not provide sufficient evidence to conclude that the mean differs from u = 50.
Expert Solution
This question has been solved!
Explore an expertly crafted, step-by-step solution for a thorough understanding of key concepts.

This is a popular solution!

Trending now
This is a popular solution!

Step by step
Solved in 2 steps

Knowledge Booster


Learn more about
Need a deep-dive on the concept behind this application? Look no further. Learn more about this topic, statistics and related others by exploring similar questions and additional content below.Recommended textbooks for you
Algebra & Trigonometry with Analytic Geometry
Algebra
ISBN:
9781133382119
Author:
Swokowski
Publisher:
Cengage
Algebra & Trigonometry with Analytic Geometry
Algebra
ISBN:
9781133382119
Author:
Swokowski
Publisher:
Cengage