Use the given information to find the following a. Provide the t-score required for this hypothesis test. (Include at least two decimal places) b. What is the p-value determined by this hypothesis test?
Use the given information to find the following a. Provide the t-score required for this hypothesis test. (Include at least two decimal places) b. What is the p-value determined by this hypothesis test?

Holt Mcdougal Larson Pre-algebra: Student Edition 2012
1st Edition
ISBN:9780547587776
Author:HOLT MCDOUGAL
Publisher:HOLT MCDOUGAL
Chapter11: Data Analysis And Probability
Section: Chapter Questions
Problem 8CR

Related questions
Question
2. Use the given information to find the following
a. Provide the t-score required for this hypothesis test. (Include at least two decimal places)
b. What is the p-value determined by this hypothesis test?
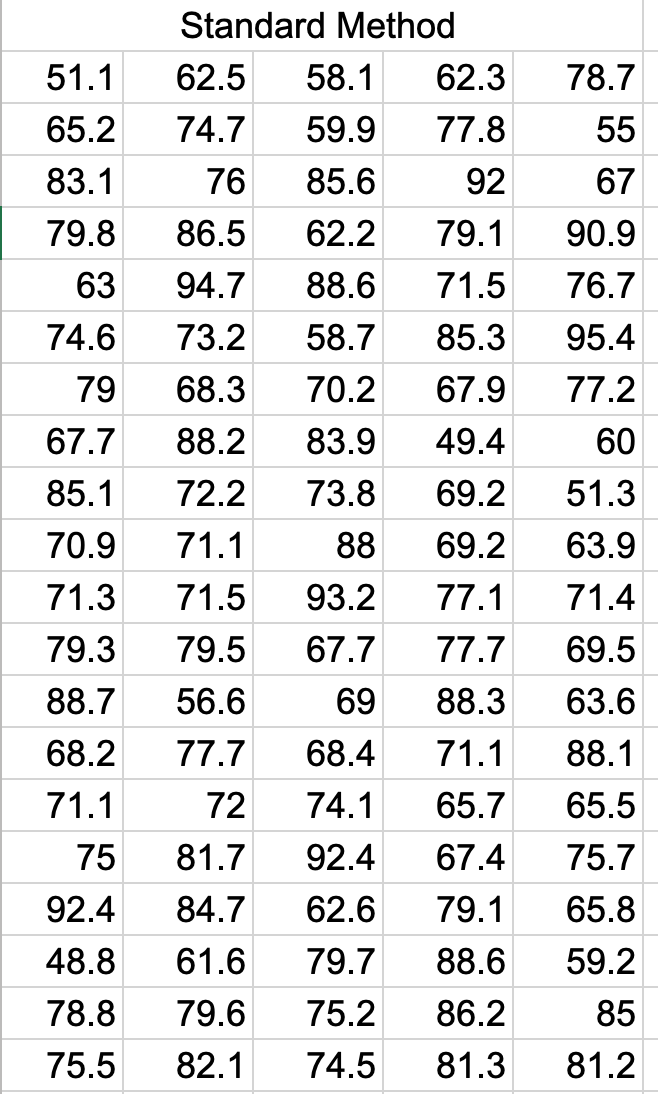
Transcribed Image Text:Standard Method
51.1
62.5
58.1
62.3
78.7
65.2
74.7
59.9
77.8
55
83.1
76
85.6
92
67
79.8
86.5
62.2
79.1
90.9
63
94.7
88.6
71.5
76.7
74.6
73.2
58.7
85.3
95.4
79
68.3
70.2
67.9
77.2
67.7
88.2
83.9
49.4
60
85.1
72.2
73.8
69.2
51.3
70.9
71.1
88
69.2
63.9
71.3
71.5
93.2
77.1
71.4
79.3
79.5
67.7
77.7
69.5
88.7
56.6
69
88.3
63.6
68.2
77.7
68.4
71.1
88.1
71.1
72
74.1
65.7
65.5
75
81.7
92.4
67.4
75.7
92.4
84.7
62.6
79.1
65.8
48.8
61.6
79.7
88.6
59.2
78.8
79.6
75.2
86.2
85
75.5
82.1
74.5
81.3
81.2
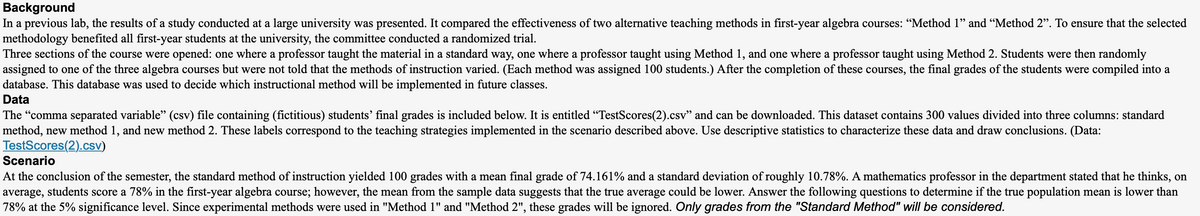
Transcribed Image Text:Background
In a previous lab, the results of a study conducted at a large university was presented. It compared the effectiveness of two alternative teaching methods in first-year algebra courses: "Method 1" and “Method 2". To ensure that the selected
methodology benefited all first-year students at the university, the committee conducted a randomized trial.
Three sections of the course were opened: one where a professor taught the material in a standard way, one where a professor taught using Method 1, and one where a professor taught using Method 2. Students were then randomly
assigned to one of the three algebra courses but were not told that the methods of instruction varied. (Each method was assigned 100 students.) After the completion of these courses, the final grades of the students were compiled into a
database. This database was used to decide which instructional method will be implemented in future classes.
Data
The "comma separated variable" (csv) file containing (fictitious) students' final grades is included below. It is entitled "TestScores(2).csv" and can be downloaded. This dataset contains 300 values divided into three columns: standard
method, new method 1, and new method 2. These labels correspond to the teaching strategies implemented in the scenario described above. Use descriptive statistics to characterize these data and draw conclusions. (Data:
TestScores(2).csv)
Scenario
At the conclusion of the semester, the standard method of instruction yielded 100 grades with a mean final grade of 74.161% and a standard deviation of roughly 10.78%. A mathematics professor in the department stated that he thinks, on
average, students score a 78% in the first-year algebra course; however, the mean from the sample data suggests that the true average could be lower. Answer the following questions to determine if the true population mean is lower than
78% at the 5% significance level. Since experimental methods were used in "Method 1" and "Method 2", these grades will be ignored. Only grades from the "Standard Method" will be considered.
Expert Solution
This question has been solved!
Explore an expertly crafted, step-by-step solution for a thorough understanding of key concepts.

Step by step
Solved in 3 steps

Recommended textbooks for you
Holt Mcdougal Larson Pre-algebra: Student Edition…
Algebra
ISBN:
9780547587776
Author:
HOLT MCDOUGAL
Publisher:
HOLT MCDOUGAL

College Algebra
Algebra
ISBN:
9781305115545
Author:
James Stewart, Lothar Redlin, Saleem Watson
Publisher:
Cengage Learning

College Algebra (MindTap Course List)
Algebra
ISBN:
9781305652231
Author:
R. David Gustafson, Jeff Hughes
Publisher:
Cengage Learning
Holt Mcdougal Larson Pre-algebra: Student Edition…
Algebra
ISBN:
9780547587776
Author:
HOLT MCDOUGAL
Publisher:
HOLT MCDOUGAL
College Algebra
Algebra
ISBN:
9781305115545
Author:
James Stewart, Lothar Redlin, Saleem Watson
Publisher:
Cengage Learning
College Algebra (MindTap Course List)
Algebra
ISBN:
9781305652231
Author:
R. David Gustafson, Jeff Hughes
Publisher:
Cengage Learning
