Consider the Locations of each as urban(1), suburban (2) and rural (3). Conduct a hypothesis test to determine whether the proportion of schools is the same for each location type. State your null and alternative hypotheses Calculate the observed and expected values for each location. Calculate the Chi-square Test statistic and the p-value Copy and paste the table from Excel Make a clear concluding statement without using the words reject or hypothesis. School Type of Term Location Type of School Average Total SAT TOEFL Score Room and Board Annual Total Cost Average Indebtedness ArizonaStateUniversity 1 2 0 1080 0 4.3 12.7 12.9 BallStateUniversity 1 1 0 985 1 4 12.5 8.21 Cal.StateUniv.-Fresno 1 1 0 955 0 5.4 13.1 8.761 ClemsonUniversity 1 3 0 1130 1 3.9 12.4 9.983 CollegeofWilliam&Mary 1 2 0 1295 1 4.5 19.4 13.424 FloridaInternationalUniv. 1 1 0 1135 0 2.7 10 4.139 FloridaStateUniversity 1 1 0 1180 1 4.5 11.5 16.5 GeorgeMasonUniversity 1 2 0 1055 1 5 17 13 GeorgiaStateUniversity 0 1 0 1115 0 7.4 15.4 8.08 MontclairStateUniversity 1 2 0 1025 0 5.3 10.2 4.5 NorthCarolinaStateUniv. 1 1 0 1145 1 4 14.3 14.991 OregonStateUniversity 0 1 0 1072 1 4.4 15.5 10.5 PurdueUniversity 1 1 0 1095 1 4.5 15.2 11.839 SanDiegoStateUniversity 1 1 0 945 1 6.2 13.6 6.75 SlipperyRockUniv.ofPenn. 1 3 0 955 0 3.6 12.9 17 SUNY-Binghamton 1 2 0 1039 1 4.6 13.4 6.245 TexasA&MUniversity 1 1 0 1150 1 3.9 12.7 14.1 Univ.ofGeorgia 0 1 0 1180 1 4 11.9 10.8 Univ.ofHawaii-Manoa 1 1 0 1075 0 4.7 12.6 3.617 Univ.ofHouston 1 1 0 1065 1 4.1 12.1 9.404 Univ.ofMaryland 1 2 0 1170 1 5.5 15.7 16.637 Univ.ofMass.-Amherst 1 2 0 1100 1 4.2 16.4 10.2 Univ.ofNevada-LasVegas 1 1 0 980 0 5.5 12.3 10 Univ.ofNewHampshire 1 3 0 1110 1 4.4 18.6 9.66 Univ.ofNorthCarolina-C.H. 1 1 0 1225 1 4.5 15.2 9.406 Univ.ofTexas-Austin 1 1 0 1215 1 3.9 12.9 10.2 Univ.ofVermont 1 1 0 1115 1 5.1 22.4 21.5 VirginiaCommonwealthUniv. 1 1 0 1005 1 4.3 16.3 14.73 VirginiaTech 1 3 0 1265 1 3.5 14.9 10.327 WestVirginiaUniversity 1 1 0 1025 1 4.6 11.7 10.7 BabsonCollege 1 2 1 1165 1 7.6 26.4 18 BostonCollege 1 2 1 1285 1 7.5 26.8 15.855 BostonUniversity 1 1 1 1235 1 7 27.9 14.463 BowdoinCollege 1 2 1 1345 1 6 27.8 13.64 BryantCollege 0 2 1 1080 1 6.7 20.6 18 BucknellUniversity 1 3 1 1255 1 5 25.4 12.5 CanisiusCollege 1 1 1 1143 0 5.9 18.8 14.824 CarnegieMellonUniversity 1 1 1 1335 1 6.1 25.6 15.683 CaseWesternReserveUniv. 1 1 1 1330 1 5 22.2 26.031 ClarkUniversity 1 1 1 1121 1 4.4 24.4 17.5 ColbyCollege 0 1 1 1275 1 5.7 27.9 11.63 ColgateUniversity 1 3 1 1300 1 5.9 27.6 9.236 CollegeofHolyCross 1 1 1 1275 1 6.7 26.8 12.634 EmoryUniversity 1 1 1 1310 1 6.5 26.6 15.309 FordhamUniversity 1 1 1 1150 1 7.4 23.4 8.593 Franklin&MarshallCollege 1 1 1 1260 1 4.5 26.4 11.5 GeorgeWashingtonUniversity 1 1 1 1235 1 6.9 26.7 14.368 GeorgetownUniversity 1 1 1 1330 1 7.5 27.5 14.013 GettysburgCollege 1 3 1 1200 1 4.8 26.4 11.75 HarvardUniversity 1 1 1 1465 1 7 28.9 11.65 IonaCollege 1 2 1 955 1 7.3 19.8 18 LafayetteCollege 1 1 1 1185 1 6.3 26.7 11.499 LaSalleUniversity 1 1 1 1105 0 6.7 20.8 11.7 LehighUniversity 1 1 1 1225 1 6 26.8 13.84 ManhattanCollege 1 1 1 952 1 7.1 22 9.268 NewYorkUniversity 1 1 1 1260 1 7.8 28.6 17.318 NiagaraUniversity 1 2 1 1065 0 5.4 17.6 11.577 NortheasternUniversity 0 1 1 1055 1 8.2 23.4 25.603 NorthwesternUniversity 0 2 1 1350 1 6.1 24.2 11.98 ProvidenceCollege 1 1 1 1185 1 6.7 22.9 17.5 RiceUniversity 1 1 1 1395 1 6 18 2.323 RochesterInst.Technology 0 2 1 1185 0 6.1 21.8 17.5 SeattleUniversity 0 1 1 1100 1 5.3 19.5 12 SetonHallUniversity 1 2 1 1030 1 7.1 20.8 14.9 SienaCollege 1 2 1 1095 0 5.4 17.6 18.248 SouthernMethodistUniversity 1 2 1 1150 1 5.3 21.3 12.113 St.BonaventureUniversity 1 3 1 1098 1 5.1 17.5 14 StanfordUniversity 0 2 1 1430 1 7.3 27.8 12.774 SyracuseUniversity 1 1 1 1180 1 7.2 24.3 14.5 TulaneUniversity 1 1 1 1270 1 6.3 27.5 13.845 Univ.ofChicago 0 1 1 1370 1 7.3 28.8 14.073 Univ.ofMiami 1 2 1 1145 1 7.1 25.7 16.068 Univ.ofNotreDame 1 2 1 1320 1 4.8 23.8 16.572 Univ.ofPennsylvania 1 1 1 1355 1 7.5 28.6 17.621 Univ.ofPortland 1 1 1 1135 0 4.5 18.9 13.896 Univ.ofScranton 0 1 1 1115 0 6.6 21.6 13.5 VanderbiltUniversity 1 1 1 1295 1 7.1 27.3 14.5 VillanovaUniversity 1 2 1 1242 1 7 24.8 17.125 WakeForestUniversity 1 2 1 1280 1 5.2 23.7 18.703 YaleUniversity 1 1 1 1450 1 6.7 28.9 13.574
Consider the Locations of each as urban(1), suburban (2) and rural (3). Conduct a hypothesis test to determine whether the proportion of schools is the same for each location type. State your null and alternative hypotheses Calculate the observed and expected values for each location. Calculate the Chi-square Test statistic and the p-value Copy and paste the table from Excel Make a clear concluding statement without using the words reject or hypothesis. School Type of Term Location Type of School Average Total SAT TOEFL Score Room and Board Annual Total Cost Average Indebtedness ArizonaStateUniversity 1 2 0 1080 0 4.3 12.7 12.9 BallStateUniversity 1 1 0 985 1 4 12.5 8.21 Cal.StateUniv.-Fresno 1 1 0 955 0 5.4 13.1 8.761 ClemsonUniversity 1 3 0 1130 1 3.9 12.4 9.983 CollegeofWilliam&Mary 1 2 0 1295 1 4.5 19.4 13.424 FloridaInternationalUniv. 1 1 0 1135 0 2.7 10 4.139 FloridaStateUniversity 1 1 0 1180 1 4.5 11.5 16.5 GeorgeMasonUniversity 1 2 0 1055 1 5 17 13 GeorgiaStateUniversity 0 1 0 1115 0 7.4 15.4 8.08 MontclairStateUniversity 1 2 0 1025 0 5.3 10.2 4.5 NorthCarolinaStateUniv. 1 1 0 1145 1 4 14.3 14.991 OregonStateUniversity 0 1 0 1072 1 4.4 15.5 10.5 PurdueUniversity 1 1 0 1095 1 4.5 15.2 11.839 SanDiegoStateUniversity 1 1 0 945 1 6.2 13.6 6.75 SlipperyRockUniv.ofPenn. 1 3 0 955 0 3.6 12.9 17 SUNY-Binghamton 1 2 0 1039 1 4.6 13.4 6.245 TexasA&MUniversity 1 1 0 1150 1 3.9 12.7 14.1 Univ.ofGeorgia 0 1 0 1180 1 4 11.9 10.8 Univ.ofHawaii-Manoa 1 1 0 1075 0 4.7 12.6 3.617 Univ.ofHouston 1 1 0 1065 1 4.1 12.1 9.404 Univ.ofMaryland 1 2 0 1170 1 5.5 15.7 16.637 Univ.ofMass.-Amherst 1 2 0 1100 1 4.2 16.4 10.2 Univ.ofNevada-LasVegas 1 1 0 980 0 5.5 12.3 10 Univ.ofNewHampshire 1 3 0 1110 1 4.4 18.6 9.66 Univ.ofNorthCarolina-C.H. 1 1 0 1225 1 4.5 15.2 9.406 Univ.ofTexas-Austin 1 1 0 1215 1 3.9 12.9 10.2 Univ.ofVermont 1 1 0 1115 1 5.1 22.4 21.5 VirginiaCommonwealthUniv. 1 1 0 1005 1 4.3 16.3 14.73 VirginiaTech 1 3 0 1265 1 3.5 14.9 10.327 WestVirginiaUniversity 1 1 0 1025 1 4.6 11.7 10.7 BabsonCollege 1 2 1 1165 1 7.6 26.4 18 BostonCollege 1 2 1 1285 1 7.5 26.8 15.855 BostonUniversity 1 1 1 1235 1 7 27.9 14.463 BowdoinCollege 1 2 1 1345 1 6 27.8 13.64 BryantCollege 0 2 1 1080 1 6.7 20.6 18 BucknellUniversity 1 3 1 1255 1 5 25.4 12.5 CanisiusCollege 1 1 1 1143 0 5.9 18.8 14.824 CarnegieMellonUniversity 1 1 1 1335 1 6.1 25.6 15.683 CaseWesternReserveUniv. 1 1 1 1330 1 5 22.2 26.031 ClarkUniversity 1 1 1 1121 1 4.4 24.4 17.5 ColbyCollege 0 1 1 1275 1 5.7 27.9 11.63 ColgateUniversity 1 3 1 1300 1 5.9 27.6 9.236 CollegeofHolyCross 1 1 1 1275 1 6.7 26.8 12.634 EmoryUniversity 1 1 1 1310 1 6.5 26.6 15.309 FordhamUniversity 1 1 1 1150 1 7.4 23.4 8.593 Franklin&MarshallCollege 1 1 1 1260 1 4.5 26.4 11.5 GeorgeWashingtonUniversity 1 1 1 1235 1 6.9 26.7 14.368 GeorgetownUniversity 1 1 1 1330 1 7.5 27.5 14.013 GettysburgCollege 1 3 1 1200 1 4.8 26.4 11.75 HarvardUniversity 1 1 1 1465 1 7 28.9 11.65 IonaCollege 1 2 1 955 1 7.3 19.8 18 LafayetteCollege 1 1 1 1185 1 6.3 26.7 11.499 LaSalleUniversity 1 1 1 1105 0 6.7 20.8 11.7 LehighUniversity 1 1 1 1225 1 6 26.8 13.84 ManhattanCollege 1 1 1 952 1 7.1 22 9.268 NewYorkUniversity 1 1 1 1260 1 7.8 28.6 17.318 NiagaraUniversity 1 2 1 1065 0 5.4 17.6 11.577 NortheasternUniversity 0 1 1 1055 1 8.2 23.4 25.603 NorthwesternUniversity 0 2 1 1350 1 6.1 24.2 11.98 ProvidenceCollege 1 1 1 1185 1 6.7 22.9 17.5 RiceUniversity 1 1 1 1395 1 6 18 2.323 RochesterInst.Technology 0 2 1 1185 0 6.1 21.8 17.5 SeattleUniversity 0 1 1 1100 1 5.3 19.5 12 SetonHallUniversity 1 2 1 1030 1 7.1 20.8 14.9 SienaCollege 1 2 1 1095 0 5.4 17.6 18.248 SouthernMethodistUniversity 1 2 1 1150 1 5.3 21.3 12.113 St.BonaventureUniversity 1 3 1 1098 1 5.1 17.5 14 StanfordUniversity 0 2 1 1430 1 7.3 27.8 12.774 SyracuseUniversity 1 1 1 1180 1 7.2 24.3 14.5 TulaneUniversity 1 1 1 1270 1 6.3 27.5 13.845 Univ.ofChicago 0 1 1 1370 1 7.3 28.8 14.073 Univ.ofMiami 1 2 1 1145 1 7.1 25.7 16.068 Univ.ofNotreDame 1 2 1 1320 1 4.8 23.8 16.572 Univ.ofPennsylvania 1 1 1 1355 1 7.5 28.6 17.621 Univ.ofPortland 1 1 1 1135 0 4.5 18.9 13.896 Univ.ofScranton 0 1 1 1115 0 6.6 21.6 13.5 VanderbiltUniversity 1 1 1 1295 1 7.1 27.3 14.5 VillanovaUniversity 1 2 1 1242 1 7 24.8 17.125 WakeForestUniversity 1 2 1 1280 1 5.2 23.7 18.703 YaleUniversity 1 1 1 1450 1 6.7 28.9 13.574

Algebra & Trigonometry with Analytic Geometry
13th Edition
ISBN:9781133382119
Author:Swokowski
Publisher:Swokowski
Chapter9: Systems Of Equations And Inequalities
Section9.2: Systems Of Linear Equations In Two Variables
Problem 38E

Related questions

Question
Consider the Locations of each as urban(1), suburban (2) and rural (3). Conduct a hypothesis test to determine whether the proportion of schools is the same for each location type.
- State your null and alternative hypotheses
- Calculate the observed and expected values for each location.
- Calculate the Chi-square Test statistic and the p-value
- Copy and paste the table from Excel
- Make a clear concluding statement without using the words reject or hypothesis.
| School | Type of Term | Location | Type of School | Average Total SAT | TOEFL Score | Room and Board | Annual Total Cost | Average Indebtedness |
| ArizonaStateUniversity | 1 | 2 | 0 | 1080 | 0 | 4.3 | 12.7 | 12.9 |
| BallStateUniversity | 1 | 1 | 0 | 985 | 1 | 4 | 12.5 | 8.21 |
| Cal.StateUniv.-Fresno | 1 | 1 | 0 | 955 | 0 | 5.4 | 13.1 | 8.761 |
| ClemsonUniversity | 1 | 3 | 0 | 1130 | 1 | 3.9 | 12.4 | 9.983 |
| CollegeofWilliam&Mary | 1 | 2 | 0 | 1295 | 1 | 4.5 | 19.4 | 13.424 |
| FloridaInternationalUniv. | 1 | 1 | 0 | 1135 | 0 | 2.7 | 10 | 4.139 |
| FloridaStateUniversity | 1 | 1 | 0 | 1180 | 1 | 4.5 | 11.5 | 16.5 |
| GeorgeMasonUniversity | 1 | 2 | 0 | 1055 | 1 | 5 | 17 | 13 |
| GeorgiaStateUniversity | 0 | 1 | 0 | 1115 | 0 | 7.4 | 15.4 | 8.08 |
| MontclairStateUniversity | 1 | 2 | 0 | 1025 | 0 | 5.3 | 10.2 | 4.5 |
| NorthCarolinaStateUniv. | 1 | 1 | 0 | 1145 | 1 | 4 | 14.3 | 14.991 |
| OregonStateUniversity | 0 | 1 | 0 | 1072 | 1 | 4.4 | 15.5 | 10.5 |
| PurdueUniversity | 1 | 1 | 0 | 1095 | 1 | 4.5 | 15.2 | 11.839 |
| SanDiegoStateUniversity | 1 | 1 | 0 | 945 | 1 | 6.2 | 13.6 | 6.75 |
| SlipperyRockUniv.ofPenn. | 1 | 3 | 0 | 955 | 0 | 3.6 | 12.9 | 17 |
| SUNY-Binghamton | 1 | 2 | 0 | 1039 | 1 | 4.6 | 13.4 | 6.245 |
| TexasA&MUniversity | 1 | 1 | 0 | 1150 | 1 | 3.9 | 12.7 | 14.1 |
| Univ.ofGeorgia | 0 | 1 | 0 | 1180 | 1 | 4 | 11.9 | 10.8 |
| Univ.ofHawaii-Manoa | 1 | 1 | 0 | 1075 | 0 | 4.7 | 12.6 | 3.617 |
| Univ.ofHouston | 1 | 1 | 0 | 1065 | 1 | 4.1 | 12.1 | 9.404 |
| Univ.ofMaryland | 1 | 2 | 0 | 1170 | 1 | 5.5 | 15.7 | 16.637 |
| Univ.ofMass.-Amherst | 1 | 2 | 0 | 1100 | 1 | 4.2 | 16.4 | 10.2 |
| Univ.ofNevada-LasVegas | 1 | 1 | 0 | 980 | 0 | 5.5 | 12.3 | 10 |
| Univ.ofNewHampshire | 1 | 3 | 0 | 1110 | 1 | 4.4 | 18.6 | 9.66 |
| Univ.ofNorthCarolina-C.H. | 1 | 1 | 0 | 1225 | 1 | 4.5 | 15.2 | 9.406 |
| Univ.ofTexas-Austin | 1 | 1 | 0 | 1215 | 1 | 3.9 | 12.9 | 10.2 |
| Univ.ofVermont | 1 | 1 | 0 | 1115 | 1 | 5.1 | 22.4 | 21.5 |
| VirginiaCommonwealthUniv. | 1 | 1 | 0 | 1005 | 1 | 4.3 | 16.3 | 14.73 |
| VirginiaTech | 1 | 3 | 0 | 1265 | 1 | 3.5 | 14.9 | 10.327 |
| WestVirginiaUniversity | 1 | 1 | 0 | 1025 | 1 | 4.6 | 11.7 | 10.7 |
| BabsonCollege | 1 | 2 | 1 | 1165 | 1 | 7.6 | 26.4 | 18 |
| BostonCollege | 1 | 2 | 1 | 1285 | 1 | 7.5 | 26.8 | 15.855 |
| BostonUniversity | 1 | 1 | 1 | 1235 | 1 | 7 | 27.9 | 14.463 |
| BowdoinCollege | 1 | 2 | 1 | 1345 | 1 | 6 | 27.8 | 13.64 |
| BryantCollege | 0 | 2 | 1 | 1080 | 1 | 6.7 | 20.6 | 18 |
| BucknellUniversity | 1 | 3 | 1 | 1255 | 1 | 5 | 25.4 | 12.5 |
| CanisiusCollege | 1 | 1 | 1 | 1143 | 0 | 5.9 | 18.8 | 14.824 |
| CarnegieMellonUniversity | 1 | 1 | 1 | 1335 | 1 | 6.1 | 25.6 | 15.683 |
| CaseWesternReserveUniv. | 1 | 1 | 1 | 1330 | 1 | 5 | 22.2 | 26.031 |
| ClarkUniversity | 1 | 1 | 1 | 1121 | 1 | 4.4 | 24.4 | 17.5 |
| ColbyCollege | 0 | 1 | 1 | 1275 | 1 | 5.7 | 27.9 | 11.63 |
| ColgateUniversity | 1 | 3 | 1 | 1300 | 1 | 5.9 | 27.6 | 9.236 |
| CollegeofHolyCross | 1 | 1 | 1 | 1275 | 1 | 6.7 | 26.8 | 12.634 |
| EmoryUniversity | 1 | 1 | 1 | 1310 | 1 | 6.5 | 26.6 | 15.309 |
| FordhamUniversity | 1 | 1 | 1 | 1150 | 1 | 7.4 | 23.4 | 8.593 |
| Franklin&MarshallCollege | 1 | 1 | 1 | 1260 | 1 | 4.5 | 26.4 | 11.5 |
| GeorgeWashingtonUniversity | 1 | 1 | 1 | 1235 | 1 | 6.9 | 26.7 | 14.368 |
| GeorgetownUniversity | 1 | 1 | 1 | 1330 | 1 | 7.5 | 27.5 | 14.013 |
| GettysburgCollege | 1 | 3 | 1 | 1200 | 1 | 4.8 | 26.4 | 11.75 |
| HarvardUniversity | 1 | 1 | 1 | 1465 | 1 | 7 | 28.9 | 11.65 |
| IonaCollege | 1 | 2 | 1 | 955 | 1 | 7.3 | 19.8 | 18 |
| LafayetteCollege | 1 | 1 | 1 | 1185 | 1 | 6.3 | 26.7 | 11.499 |
| LaSalleUniversity | 1 | 1 | 1 | 1105 | 0 | 6.7 | 20.8 | 11.7 |
| LehighUniversity | 1 | 1 | 1 | 1225 | 1 | 6 | 26.8 | 13.84 |
| ManhattanCollege | 1 | 1 | 1 | 952 | 1 | 7.1 | 22 | 9.268 |
| NewYorkUniversity | 1 | 1 | 1 | 1260 | 1 | 7.8 | 28.6 | 17.318 |
| NiagaraUniversity | 1 | 2 | 1 | 1065 | 0 | 5.4 | 17.6 | 11.577 |
| NortheasternUniversity | 0 | 1 | 1 | 1055 | 1 | 8.2 | 23.4 | 25.603 |
| NorthwesternUniversity | 0 | 2 | 1 | 1350 | 1 | 6.1 | 24.2 | 11.98 |
| ProvidenceCollege | 1 | 1 | 1 | 1185 | 1 | 6.7 | 22.9 | 17.5 |
| RiceUniversity | 1 | 1 | 1 | 1395 | 1 | 6 | 18 | 2.323 |
| RochesterInst.Technology | 0 | 2 | 1 | 1185 | 0 | 6.1 | 21.8 | 17.5 |
| SeattleUniversity | 0 | 1 | 1 | 1100 | 1 | 5.3 | 19.5 | 12 |
| SetonHallUniversity | 1 | 2 | 1 | 1030 | 1 | 7.1 | 20.8 | 14.9 |
| SienaCollege | 1 | 2 | 1 | 1095 | 0 | 5.4 | 17.6 | 18.248 |
| SouthernMethodistUniversity | 1 | 2 | 1 | 1150 | 1 | 5.3 | 21.3 | 12.113 |
| St.BonaventureUniversity | 1 | 3 | 1 | 1098 | 1 | 5.1 | 17.5 | 14 |
| StanfordUniversity | 0 | 2 | 1 | 1430 | 1 | 7.3 | 27.8 | 12.774 |
| SyracuseUniversity | 1 | 1 | 1 | 1180 | 1 | 7.2 | 24.3 | 14.5 |
| TulaneUniversity | 1 | 1 | 1 | 1270 | 1 | 6.3 | 27.5 | 13.845 |
| Univ.ofChicago | 0 | 1 | 1 | 1370 | 1 | 7.3 | 28.8 | 14.073 |
| Univ.ofMiami | 1 | 2 | 1 | 1145 | 1 | 7.1 | 25.7 | 16.068 |
| Univ.ofNotreDame | 1 | 2 | 1 | 1320 | 1 | 4.8 | 23.8 | 16.572 |
| Univ.ofPennsylvania | 1 | 1 | 1 | 1355 | 1 | 7.5 | 28.6 | 17.621 |
| Univ.ofPortland | 1 | 1 | 1 | 1135 | 0 | 4.5 | 18.9 | 13.896 |
| Univ.ofScranton | 0 | 1 | 1 | 1115 | 0 | 6.6 | 21.6 | 13.5 |
| VanderbiltUniversity | 1 | 1 | 1 | 1295 | 1 | 7.1 | 27.3 | 14.5 |
| VillanovaUniversity | 1 | 2 | 1 | 1242 | 1 | 7 | 24.8 | 17.125 |
| WakeForestUniversity | 1 | 2 | 1 | 1280 | 1 | 5.2 | 23.7 | 18.703 |
| YaleUniversity | 1 | 1 | 1 | 1450 | 1 | 6.7 | 28.9 | 13.574 |
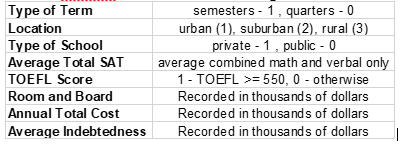
Transcribed Image Text:Type of Term
semesters - 1, quarters - 0
urban (1), suburban (2), rural (3)
private - 1, public - 0
average combined math and verbal only
1- TOEFL >= 550, 0 - otherwise
Location
Type of School
Average Total SAT
TOEFL Score
Room and Board
Recorded in thousands of dollars
Annual Total Cost
Recorded in thousands of dollars
Average Indebtedness
Recorded in thousands of dollars
Expert Solution
This question has been solved!
Explore an expertly crafted, step-by-step solution for a thorough understanding of key concepts.

This is a popular solution!

Trending now
This is a popular solution!

Step by step
Solved in 5 steps

Knowledge Booster


Learn more about
Need a deep-dive on the concept behind this application? Look no further. Learn more about this topic, statistics and related others by exploring similar questions and additional content below.Recommended textbooks for you
Algebra & Trigonometry with Analytic Geometry
Algebra
ISBN:
9781133382119
Author:
Swokowski
Publisher:
Cengage

Algebra: Structure And Method, Book 1
Algebra
ISBN:
9780395977224
Author:
Richard G. Brown, Mary P. Dolciani, Robert H. Sorgenfrey, William L. Cole
Publisher:
McDougal Littell

Glencoe Algebra 1, Student Edition, 9780079039897…
Algebra
ISBN:
9780079039897
Author:
Carter
Publisher:
McGraw Hill
Algebra & Trigonometry with Analytic Geometry
Algebra
ISBN:
9781133382119
Author:
Swokowski
Publisher:
Cengage
Algebra: Structure And Method, Book 1
Algebra
ISBN:
9780395977224
Author:
Richard G. Brown, Mary P. Dolciani, Robert H. Sorgenfrey, William L. Cole
Publisher:
McDougal Littell
Glencoe Algebra 1, Student Edition, 9780079039897…
Algebra
ISBN:
9780079039897
Author:
Carter
Publisher:
McGraw Hill

Algebra for College Students
Algebra
ISBN:
9781285195780
Author:
Jerome E. Kaufmann, Karen L. Schwitters
Publisher:
Cengage Learning

Intermediate Algebra
Algebra
ISBN:
9781285195728
Author:
Jerome E. Kaufmann, Karen L. Schwitters
Publisher:
Cengage Learning
