Consider the market for designer purses. The following graph shows the demand and supply for designer purses before the government imposes any taxes First, use the black point (plus symbol) to indicate the equilibrium price and quantity of designer purses in the absence of a tax. Then use the green point (triangle symbol) to shade the area representing total consumer surplus (CS) at the equilibrium price. Next, use the purple poinit (diamond symbol) to shade the area representing total producer surplus (PS) at the equilibrium price. Before Tax 150 135 Equilbrium 120 Demand 90 Consumer Surplus Producer Surplus Supply 45 20 4 s 100 120 340 100 160 200 (end ed oal 3d
Consider the market for designer purses. The following graph shows the demand and supply for designer purses before the government imposes any taxes First, use the black point (plus symbol) to indicate the equilibrium price and quantity of designer purses in the absence of a tax. Then use the green point (triangle symbol) to shade the area representing total consumer surplus (CS) at the equilibrium price. Next, use the purple poinit (diamond symbol) to shade the area representing total producer surplus (PS) at the equilibrium price. Before Tax 150 135 Equilbrium 120 Demand 90 Consumer Surplus Producer Surplus Supply 45 20 4 s 100 120 340 100 160 200 (end ed oal 3d

Chapter4: Markets In Action
Section: Chapter Questions
Problem 12SQ

Related questions
Question
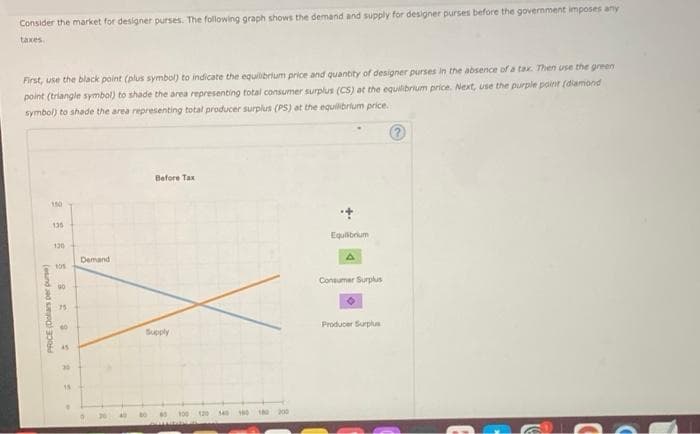
Transcribed Image Text:Consider the market for designer purses. The following graph shows the demand and supply for designer purses before the government imposes any
taxes
First, use the black point (plus symbol) to indicate the equilibrium price and quantity of designer purses in the absence of a tax. Then use the green
point (triangle symbol) to shade the area representing total consumer surplus (CS) at the equilibrium price. Next, use the purple poinit (diamond
symbol) to shade the area representing total producer surplus (PS) at the equilibrium price.
Before Tax
150
135
Equilbrium
120
Demand
Consumer Surplus
90
Producer Surplus
Supply
45
20
340
00 10 200
4 s 100 120
PRICE (Delars per pue)
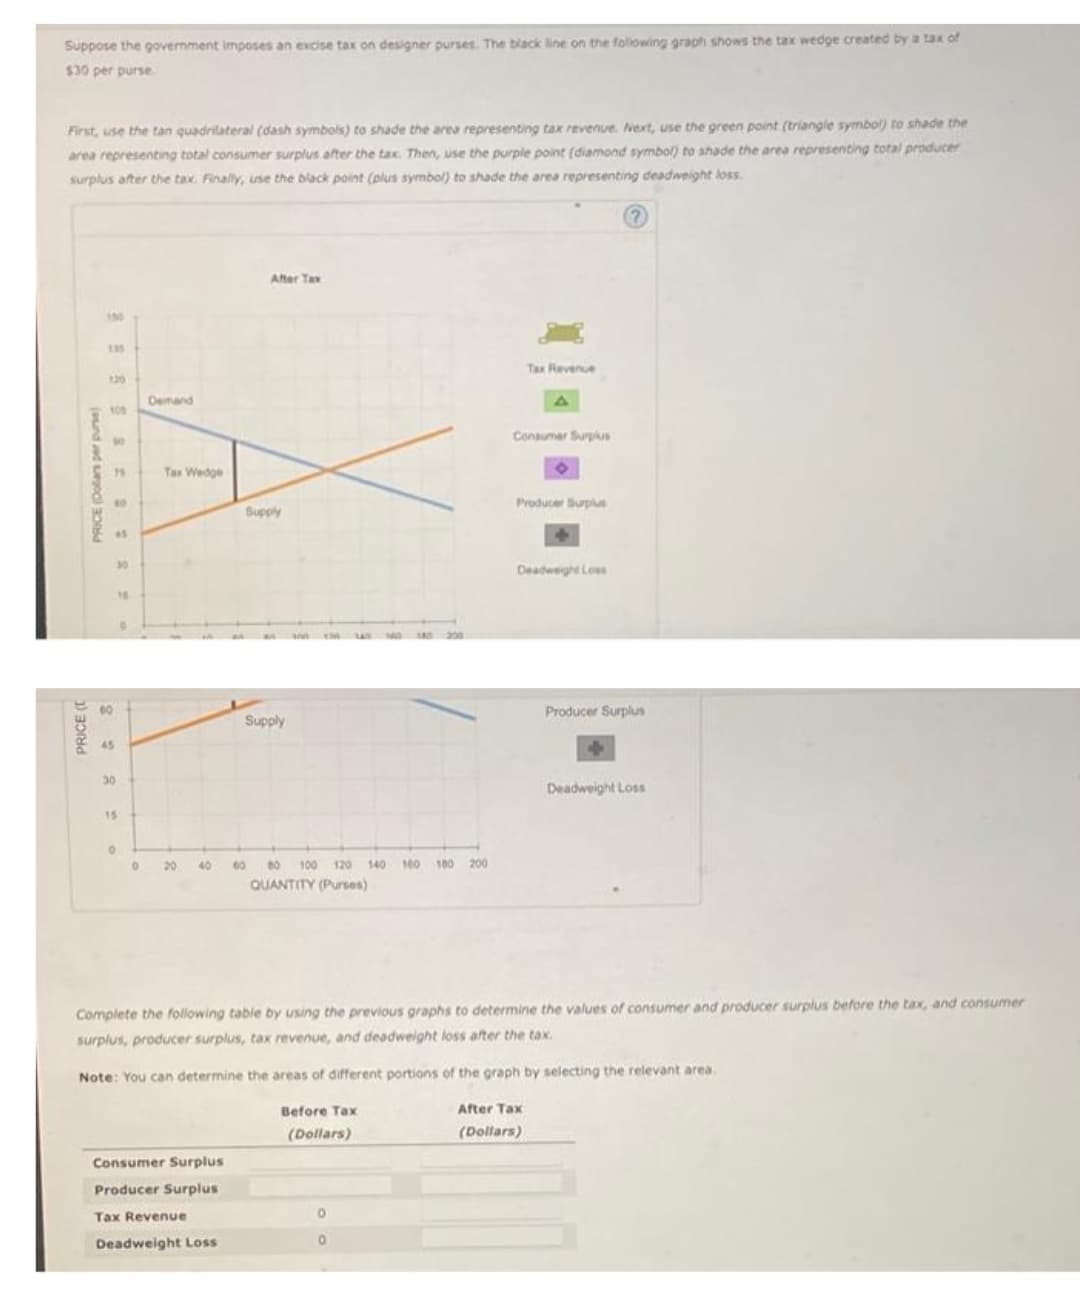
Transcribed Image Text:Suppose the govermment imposes an excise tax on designer purses. The black line on the folowing graph shows the tax wedge created by a tax of
$30 per purse
First, use the tan quadrilateral (dash symbols) to shade the area representing tax revenue. Next, use the green point (triangle symbol) to shade the
area representing total consumer surplus after the tax. Then, use the purple point (diamond symbol) to shade the area representing total producer
surplus after the tax. Finally, use the black point (plus symbol) to shade the area representing deadweight loss
2)
After Tax
150
135
Tax Revenue
120
Demand
100
Consumer Surplus
to
Tax Wedge
Producer Burplus
Supply
45
30
Deadwight Loes
200
00
Producer Surplus
Supply
45
30
Deadweight Loss
15
20
40
60
80
100
120 140 M60 100 200
QUANTITY (Purses)
Complete the following table by using the previous graphs to determine the values of consumer and producer surplus before the tax, and consumer
surplus, producer surplus, tax revenue, and deadweight loss after the tax.
Note: You can determine the areas of different portions of the graph by selecting the relevant area.
Before Tax
After Tax
(Dollars)
(Dollars)
Consumer Surplus
Producer Surplus
Tax Revenue
Deadweight Loss
PRICE (
Expert Solution
This question has been solved!
Explore an expertly crafted, step-by-step solution for a thorough understanding of key concepts.

This is a popular solution!

Trending now
This is a popular solution!

Step by step
Solved in 2 steps with 2 images

Knowledge Booster


Learn more about
Need a deep-dive on the concept behind this application? Look no further. Learn more about this topic, economics and related others by exploring similar questions and additional content below.Recommended textbooks for you


Essentials of Economics (MindTap Course List)
Economics
ISBN:
9781337091992
Author:
N. Gregory Mankiw
Publisher:
Cengage Learning
