Consider the same firm from the Monday assignment but now let's call that cost schedule total variable cost. Q 1 2 3 4 5 6 7 8 9 TVC 12 20 24 28 34 42 52 64 78 And let's imagine that there is fixed costs of 18 which is sunk in the short run. a. Show this firm's average total cost, average variable cost and marginal cost on a graph. Indicate the efficient scale (I don't think the book uses the words "efficient scale" but it's the quantity where profit would be zero when P=MC. We will discuss what I mean by "efficient scale but probably not before Thursday. By "indicate" I mean give the quantity and MC. I don't need every point to be exactly to scale, I just care about the general shape of the curves, where things cross and the location and numbers for the efficient scale.) b. Now imagine that this market is perfectly competitive with many firms that are all identical. On another graph, show the supply curve in the long run. There should be one number on this graph. (I can't tell you what it is without giving away the main point of this question but suffice it to say that if you're not sure what number to add, you are missing something important.)


Consider the same firm from the Monday assignment but now let's call that cost schedule total variable cost.
Q 1 2 3 4 5 6 7 8 9
TVC 12 20 24 28 34 42 52 64 78
And let's imagine that there is fixed costs of 18 which is sunk in the short run.
a. Show this firm's
b. Now imagine that this market is
a)
| Q | TVC | TFC | TC | ATC | AVC | AFC | MC |
| 1 | 12 | 18 | 30 | 30 | 12 | 18 | - |
| 2 | 20 | 18 | 38 | 19 | 10 | 9 | 8 |
| 3 | 24 | 18 | 42 | 14 | 8 | 6 | 4 |
| 4 | 28 | 18 | 46 | 11.5 | 7 | 4.5 | 4 |
| 5 | 34 | 18 | 52 | 10.4 | 6.8 | 3.6 | 6 |
| 6 | 42 | 18 | 60 | 10 | 7 | 3 | 8 |
| 7 | 52 | 18 | 70 | 10 | 7.42 | 2.58 | 10 |
| 8 | 64 | 18 | 82 | 10.25 | 8 | 2.25 | 8 |
| 9 | 78 | 18 | 96 | 10.67 | 8.67 | 2 | 14 |
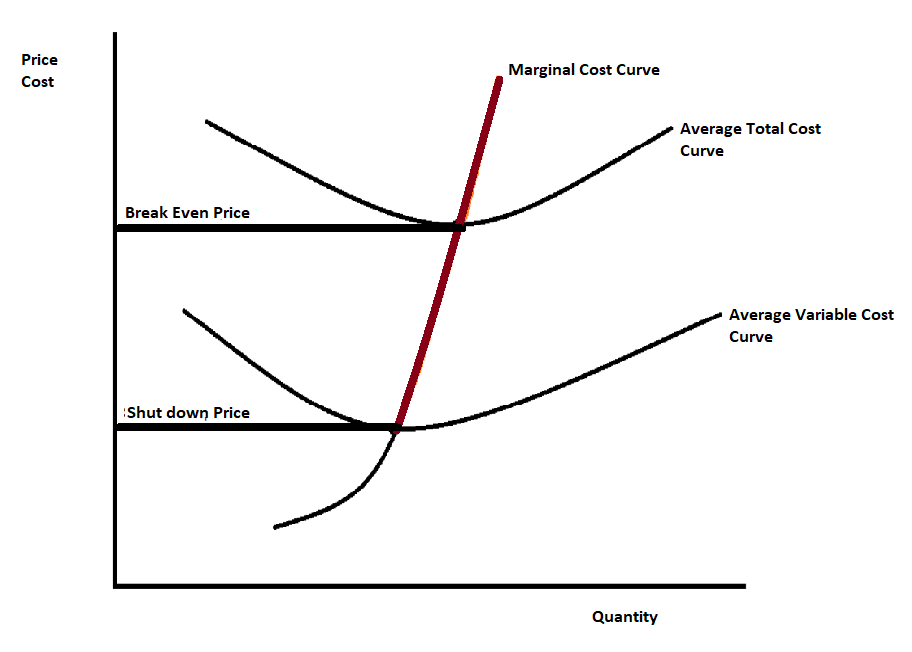
The marginal cost curve represents the profit-maximizing output at different market prices. That is why is the marginal cost curve is the short-run supply curve of a perfectly competitive firm. It is not the entire marginal cost.
In fact, it is that part of the marginal cost curve that lies above the average variable cost. This is because a perfectly competitive firm produces that much quantity where profit gets maximized which requires the equality of MR and MC. Under Perfect competition, MR is equal to Price.
Therefore a perfectly competitive firm produces that much output where the price is equal to marginal cost.
When the Marginal cost is less than the average variable cost, then equating price with the marginal cost that price will be less than the average variable cost which means that there will be operating loss.
If the price falls below the average variable cost then the firm will continue production and the quantity supplied will be 0.

Trending now
This is a popular solution!

Step by step
Solved in 2 steps with 2 images


