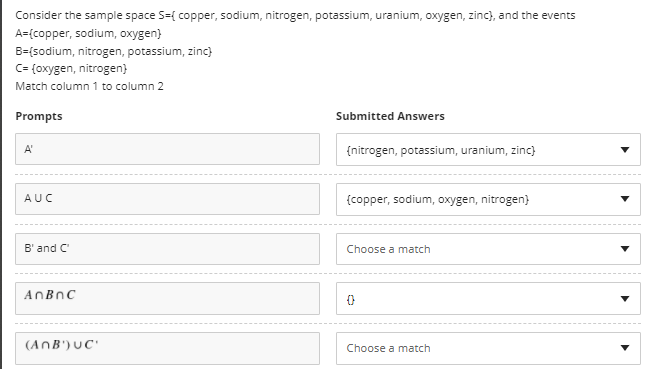
Consider the sample space S={ copper, sodium, nitrogen, potassium, uranium, oxygen, zinc), and the events A=[copper, sodium, oxygen) B=[sodium, nitrogen, potassium, zinc) C= {oxygen, nitrogen} Match column 1 to column 2 Prompts Submitted Answers A' {nitrogen, potassium, uranium, zinc) AUC (copper, sodium, oxygen, nitrogen) B' and C Choose a match ANBNC (AnB') UC' Choose a match


Q: A sample of students involved in laboratory accidents was categorized by age. The results appear as:...
A: Gvien data is Age #of accidents 16 - 25 15 26 - 35 25 36 - 45 27 46 - 55 24 56 - 65 12 ...
Q: Assume that females have pulse rates that are normally distributed with a mean of u = 73.0 beats per...
A:
Q: f. all are clubs or all are red cards? g. exactly one is a number (non-face) card?
A: g. 3 cards are selected from a standard deck of 52 cards and laid out in a row on a table. There are...
Q: Lacy draws a club from a standard deck of 52 cards. Without replacing the first card, she then proce...
A: Lacy draws a club from a standard deck of 52 cards. Without replacing the first card, she then proce...
Q: A committee of 4 people is to be appointed from 3 officers of the production department, 4 officers ...
A: Note: There is a small typo in the question. Sales department was mentioned 2 times and purchase dep...
Q: The table below shows the color and the model of cars purchased by 160 randomly selected customers ...
A: For the given data Use a 5 percent level of significance to test the null hypothesis that color chos...
Q: 3. The table provides data associated with a study conducted at the Virginia Polytechnic Institute a...
A: The data of two samples of 10 northern red oak seedling are given where one sample was provide nitro...
Q: In a recent year (365 days), there were 619 murders in a city. Find the mean number of murders per d...
A:
Q: If you randomly select a card from a well-shuffled standard deck of 52 cards, what is the probabilit...
A:
Q: Students in QMB 3600-Quantitative Methods in Business course decided to research the relationship be...
A: As per the honor code, We’ll answer the first question since the exact one wasn’t specified. Please ...
Q: what is the mean and standard deviation of all z distributions?
A: Z is distributed as a standard normal variable.
Q: Construct a 95% confidence interval for the mean difference in calcium levels in the soil prior to a...
A: Q.1)
Q: List the elements in the Sample Space S in the form of (x,y). b. List the elements corresponding t...
A: Given : Pair of dice is tossed (green and red) X denote outcome in the green die Y denote outcome i...
Q: Regression analysis can be used to test whether the market efficiently uses information in valuing s...
A: 1. From the given information, Decision Rule: If p-value ≤ α, then reject the null hypothesis. C...
Q: 2. vo dice are tossed 65 times and the sums of the numbers are corded in the table. Draw a bar graph...
A:
Q: Years of Annual Sales Salesperson Experience ($1,000s) 80 2. 97 3.
A: Given: The data is shown below Years of exp Annual sales 1 80 3 97 4 102 4 107 6 103 ...
Q: a. If 1 candy is randomly selected, find the probability that it weighs more than 0.8539 g. The prob...
A:
Q: Take the following scores from an interval scale and create a frequency table with all appropriate c...
A: For the Given data, create a frequency table with all appropriate columns
Q: 1st statement: rho in rank correlation of ordinal data is best used when there are a few number of s...
A: The given statements are: 1) rho in rank correlation of ordinal data is best used when there are a f...
Q: #4. A college president commissioned a study to find the proportion of students enrolled at her coll...
A:
Q: In a recent year, an author wrote 184 checks. Use the Poisson distribution to find the probability t...
A:
Q: A. The scores of students in the midyear examination for Mathematics has a mean of 32 and a standard...
A: Given that Mean = 32, SD = 5 Find the Z-scores for 1. x = 37 2. x = 22 3. x = 33 4. x = 28 5. x = 30
Q: Calculate the mean and standard deviation for the following set of analytical results: 34.65, 34.97...
A:
Q: 4. A study was conducted to test diastolic blood pressure readings between patients with sedentary l...
A: The data of two groups A and B's diastolic blood pressure readings are given as: Group A Group B ...
Q: 8. Suppose Jack has 1 red ball, 1 orange ball, 1 blue ball, 1 yellow ball, 1 black ball and 1 green ...
A: Given that Jack has Red ball = 1 Orange ball = 1 Blue ball = 1 yellow ball = 1 black ball = 1 Gre...
Q: Problem 5-32. The joint probability distribution of two randoni variables X and Y is given by : P (X...
A:
Q: dy (a) Find dr (b) Write down the coordinates of the local maximum. Write down an integral represent...
A:
Q: 8. You grow 20 crystals from a solution and measure the length of each crystal in millimeters. Here ...
A:
Q: Entrance exam scores at Cititon University are normally distributed with a mean of 552 and a standar...
A:
Q: Out of 100 packages 150. Use your knowledge of normal distribution to estimate the average number of...
A: Given 68 out of 100 is 68% Vide the Empirical rule, also known as 68 - 95 - 99.7 percent rule stated...
Q: Delta Airlines' flights from Boston to Seattle are on time 60 % of the time. Suppose 9 flights are r...
A: Given : Delta Airlines flights from Boston to Seattle are on time 60% Let p : Proportion of flights ...
Q: Weights Freq Classmark Relative Freq <CF (а) - (b) (f) (k) 0.05 (0) (c) - 1.96 (g) (1) (m) 13 1.97 -...
A: Given data is Weights Freq Classmark Relative Freq <CF (a)-(b) (f) (k) 0.05 (o) (c)-1.96 (...
Q: For the following frequency distribution, what is ΣX? X f 30-34 1 25-29 ...
A: Given data is x f 30-34 1 25-29 1 20-24 3 15-19 2 10-14 1
Q: For the data 69.65, 69.63, 69.64, 69.21, calculate the 95% confidence limit. (A) 69.6 ± 0.5 B 69.7 +...
A: Given data is69.65 , 69.63 , 69.64 , 69.21sample size(n)=4sample mean(x¯)=69.65+69.63+69.64+69.214sa...
Q: Assume that human body temperatures are normally distributed with a mean of 98.20°F and a standard d...
A: Let , random variable X be the human body temperatures. The random variable X is normally distribute...
Q: persons whose daily wages (in Draw a histogram for the following below. are given Daily wages 0-50 5...
A: Histogram: Step 1 : Daily wages are marked along the X-axis and labeled as “Wages”. Step 2 : Number...
Q: Recently, 18.3% of visitors to the Travelocity website hailed from the Google search engine. A rando...
A: It is given that Sample size n = 130 Population proportion p = 18.3% = 0.183
Q: This The data below represent the number of days absent, x, and the final grade, y, for a sample of ...
A: For the given data set ( a ) Least square regression line ( e ) Select the correct choice
Q: You are taking a quiz that has 10 multiple-choice questions. If each question has 3 possible answers...
A:
Q: Suppose that in a certain region of the country the standard deviation of the duration of first marr...
A: We have given that, Sample mean (x̄) = 8.5, standard deviation (s)=1.2 and sample size (n) = 25 The...
Q: You have a table of standard normal probabilities that gives you the area of the curve from the left...
A:
Q: The take-home salary (in kwacha) of 30 unskilled workers from a company for a particular month was ...
A:
Q: ) Compute the probability of drawing two clubs from a standard deck of 52 cards. Round your answer t...
A: Given Total number of club card=13 Total number of face card=12 Total number of aces card=4
Q: A product is made by 3 machines, B1, B2, and B3 with 30%, 45% & 25%, respectively. The machines prod...
A: Given: P(B1) = 0.30 P(B2) = 0.45 P(B3) = 0.25 P(D|B1) = 0.02 P(D|B2) = 0.03 P(D|B3) = 0.02
Q: What is the most suitable statistical test in order to determine whether weight, height, and age exp...
A: Given that What is the most suitable statistical test in order to determine whether weight, height,...
Q: The game of American roulette involves spinning a wheel with 38 slots: 18 red, 18 black, and 2 green...
A: If the probability of getting selected for each outcome is equal then such outcomes can be termed as...
Q: Test the claim that the treatment population has a smaller mean than the placebo population,
A: Given,
Q: а. Mean b. Median с. Standard Deviation d. Mode Construct a Relative Frequency Histogram Construct a...
A: According to our policy I have solved only 3 subparts for remaining please repost the question . Tha...
Q: A population has a mean of 1398.25 and standard deviation of 246.85 13 The margin of error for t...
A: A population has a mean of 1398.25 and standard deviation of 246.85
Q: Twelve of the top 20 finishers in the 2009 PGA Championship at Hazeltine National Golf Club in Chask...
A:

Step by step
Solved in 6 steps

- Let X1 and X2 constitute a random sample from a nor-mal population with σ2 = 1. If the null hypothesis μ = μ0 is to be rejected in favor of the alternative hypothesis μ = μ1 > μ0 when x > μ0 + 1, what is the size of the criti-cal region?Let p1 and p2 be the respective proportions of women with iron-deficiency anemia in each of two developing countries. A random sample of 1900 women from the first country yielded 513 women with iron-deficiency anemia, and an independently chosen, random sample of 1700 women from the second country yielded 515 women with iron-deficiency anemia. Can we conclude, at the 0.10 level of significance, that the proportion of women with anemia in the first country is less than the proportion of women with anemia in the second country? Perform a one-tailed test. Then complete the parts below.Carry your intermediate computations to three or more decimal places and round your answers as specified in the parts below. a. State the null hypothesis H0 and the alternative hypothesis H1. b. Find the values of the test statistic. c. FInd the p-value. d. Can we conclude that the proportion of women with anemia in the first country is less than the proportion of women with anemia in the second country?Let X1, …, Xn be a random sample from a population with the Poisson(λ) distribution. Find the MLE of λ.
- 1) A cement producer, manufactures and then fills 40kg-bags of powder cement on twodistinct production tracks located in separate suburbs. To determine whether differencesexist between the average fill rates for the two tracks, a random sample of 25 bags fromTrack 1 and a random sample of 16 bags from Track 2 were recently selected. Each bag’sweight was measured and the following information measures from the samples arereported:Production ProductionTrack 1 Track 2n1 = 25 n2 = 16x2 = 40.02 x1 = 39.87 s1 = 0.59 s2 = 0.88 Supervision believes that the fill rates of the two tracks are normally distributed with equalvariances.Construct a 95% confidence interval estimate of the true mean difference between the twotracks.--------------------------------------------------------------------------------------------------------------2) Two independent simple random samples were selected from two normallydistributed populations with unequal variances yielded the following information:Sample 1…Suppose a simple random sample of size n equals 1000 is obtained from a population whose size is N equals 2 comma 000 comma 000 and whose population proportion with a specified characteristic is p equals 0.75. Complete parts (a) through (c) below.If X1, X2, ... , Xn constitute a random sample from anormal population with μ = 0, show that ni=1X2inis an unbiased estimator of σ2.
- Researchers are studying two populations of sea turtles. In population D, 30 percent of the turtles have a shell length greater than 2 feet. In population E, 20 percent of the turtles have a shell length greater than 2 feet. From a random sample of 40 turtles selected from D, 15 had a shell length greater than 2 feet. From a random sample of 60 turtles selected from E, 11 had a shell length greater than 2 feet. Let pDrepresent the sample proportion for D, and let pE represent the sample proportion for E. (a) What is the value of the difference pD - pE? Show your work. (b) What are the mean and standard deviation of the sampling distribution of the difference in sample proportions pD - pE? Show your work and label each value. (c) Can it be assumed that the sampling distribution of the difference of the sample proportions pD - pE is approximately normal? Justify your answer.Suppose that Z1, Z2, . . . , Zn are statistically independent random variables. Define Y as the sum of squares of these random variablesSuppose a simple random sample of size n = 125 is obtained from a population whose size is N = 30,000 and whose population proportion with a specified characteristic is p = 0.6
- Suppose a simple random sample of size n=125 is obtained from a population whose size is N=10,000 and whose population proportion with a specified characteristic is p= 0.4Suppose that three random variables X1, X2, X3 form a random sample from the uniform distribution on interval [0, 1]. Determine the value of E[(X1-2X2+X3)2]Suppose x has a distribution with μ = 10 and σ = 2.A button hyperlink to the SALT program that reads: Use SALT.(a) If a random sample of size n = 44 is drawn, find μx, σ x and P(10 ≤ x ≤ 12). (Round σx to two decimal places and the probability to four decimal places.)μx = σ x = P(10 ≤ x ≤ 12) = (b) If a random sample of size n = 66 is drawn, find μx, σ x and P(10 ≤ x ≤ 12). (Round σ x to two decimal places and the probability to four decimal places.)μx = σ x = P(10 ≤ x ≤ 12) =