Consider the set of ordered pairs shown below. Assuming that the regression equation is y=2.063 +0.531x and the SSE=4.813, construct a 90% prediction interval for x = 5. X y 6 5 0 2 2 3 Click the icon to view a portion of the Student's t-distribution table. UPL = LPL = 4 6 4 4 4 3 D *** Calculate the upper and lower limits of the prediction interval.
Consider the set of ordered pairs shown below. Assuming that the regression equation is y=2.063 +0.531x and the SSE=4.813, construct a 90% prediction interval for x = 5. X y 6 5 0 2 2 3 Click the icon to view a portion of the Student's t-distribution table. UPL = LPL = 4 6 4 4 4 3 D *** Calculate the upper and lower limits of the prediction interval.

Glencoe Algebra 1, Student Edition, 9780079039897, 0079039898, 2018
18th Edition
ISBN:9780079039897
Author:Carter
Publisher:Carter
Chapter4: Equations Of Linear Functions
Section4.6: Regression And Median-fit Lines
Problem 4GP

Related questions
Question
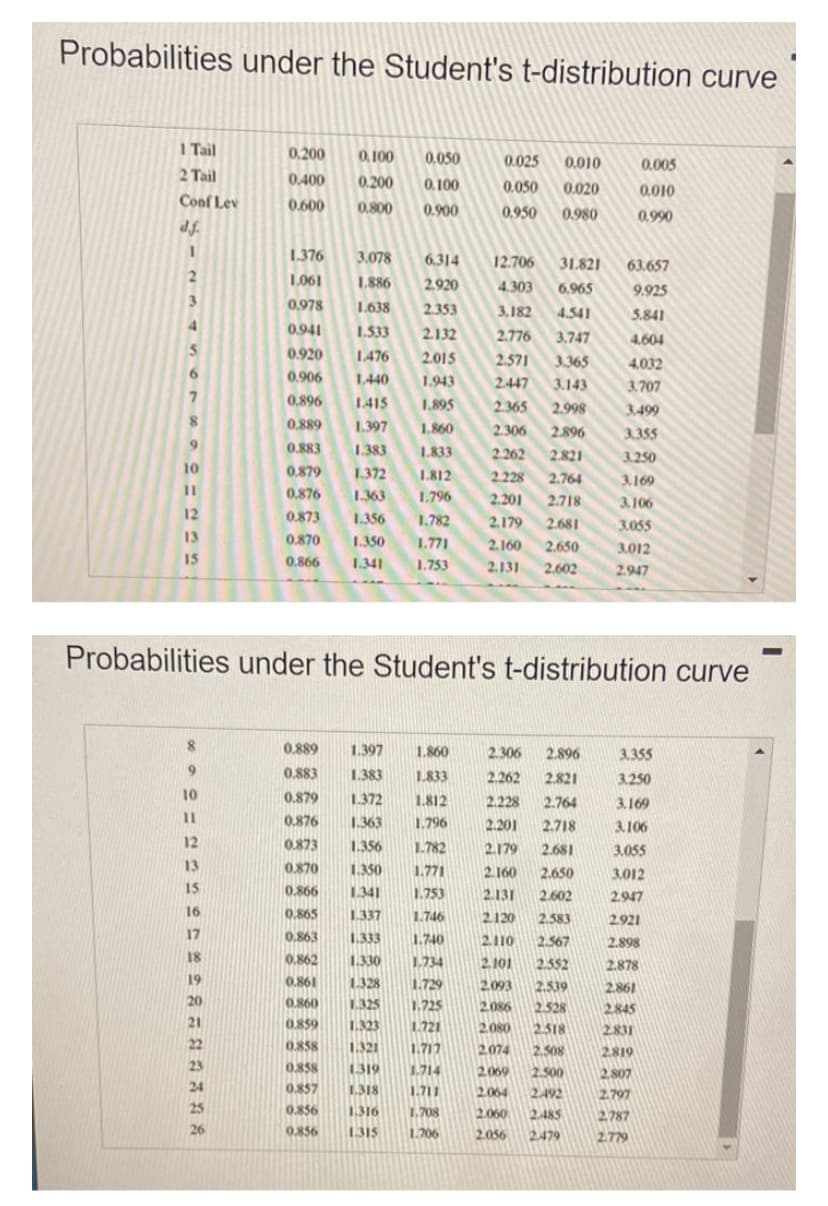
Transcribed Image Text:Probabilities under the Student's t-distribution curve
1 Tail
2 Tail
Conf Lev
d.f.
1
2
9
10
12
13
15
9
10
11
12
13
15
0,200 0.100 0.050
0.200 0.100
0.400
0.600
0.800 0.900
16
17
18
19
20
21
22
23
24
25
26
1.376 3.078 6.314
1.061
1.886
2.920
0,978
1.638
2.353
0.941
1.533
2.132
0.920
1.476
2.015
0.906
1,440
1.943
0,896
1.415
1.895
0.889
1.397 1.860
0.883
1.383 1.833
0.879
1.372
1.812
0.876
1.363
1.796
0.873
1.356 1.782
0.870 1.350 1.771
0.866 1.341
1.753
0.025
0.010
0.050
0.020
0.950 0.980
0.889 1.397
1.860
0.883 1.383
0.879 1.372
1.833
1.812
0.876 1.363 1.796
0.873
1.356 1.782
0.870
1.350
1.771
0.866
1.341
1.753
0.865
1.337 1.746
0.863
1.333 1.740
0.862
1.330 1.734
0.861
1.328
1.729
0.860 1.325
1.725
0.859 1.323
1.721
0.858
1.321
1.717
0.858
1.319
1.714
0.857 1.318 1.711
0.856
1.316
1.708
0.856
1.315
1.706
12.706
31.821
4.303 6.965
3.182 4.541
2.776 3.747
2.571 3.365
2.447 3.143
2.365
2.998
2.306
2.896
2.262
2.821
2.228 2.764
2.201
2.718
2.179 2.681
2.160 2.650
2.131 2.602
Probabilities under the Student's t-distribution curve
2.306 2.896
2.262 2.821
2.228
2.764
2.201 2.718
2.179 2.681
2.160 2.650
2.131 2.602
2.120 2.583
2.110 2.567
2.101 2.552
2.093 2.539
2.086
2.528
2.080 2.518
2.508
2.500
2.492
2.485
2.479
2.074
2.069
2.064
2.060
2.056
0.005
0.010
0.990
63.657
9.925
5.841
4.604
4.032
3.707
3.499
3.355
3.250
3.169
3.106
3.055
3.012
2.947
3.355
3.250
3.169
3.106
3.055
3.012
2.947
2.921
2.898
2.878
2.861
2.845
2.831
2.819
2.807
2.797
2.787
2.779
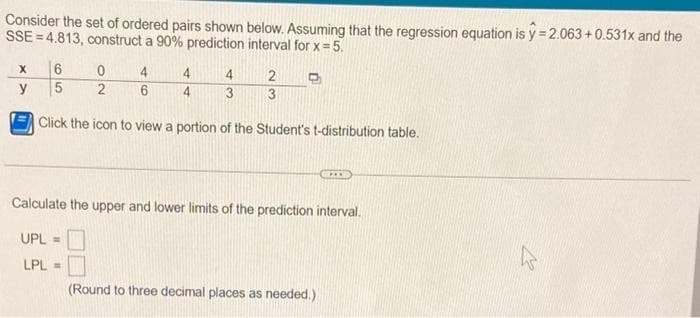
Transcribed Image Text:Consider the set of ordered pairs shown below. Assuming that the regression equation is y=2.063 +0.531x and the
SSE=4.813, construct a 90% prediction interval for x = 5.
X
y
6
5
0
2
4
6
4
4
4
3
2 D
3
Click the icon to view a portion of the Student's t-distribution table.
GOL
Calculate the upper and lower limits of the prediction interval.
UPL =
LPL =
(Round to three decimal places as needed.)
M
Expert Solution
This question has been solved!
Explore an expertly crafted, step-by-step solution for a thorough understanding of key concepts.

Step by step
Solved in 3 steps with 1 images

Recommended textbooks for you
Glencoe Algebra 1, Student Edition, 9780079039897…
Algebra
ISBN:
9780079039897
Author:
Carter
Publisher:
McGraw Hill

College Algebra
Algebra
ISBN:
9781305115545
Author:
James Stewart, Lothar Redlin, Saleem Watson
Publisher:
Cengage Learning

Functions and Change: A Modeling Approach to Coll…
Algebra
ISBN:
9781337111348
Author:
Bruce Crauder, Benny Evans, Alan Noell
Publisher:
Cengage Learning
Glencoe Algebra 1, Student Edition, 9780079039897…
Algebra
ISBN:
9780079039897
Author:
Carter
Publisher:
McGraw Hill
College Algebra
Algebra
ISBN:
9781305115545
Author:
James Stewart, Lothar Redlin, Saleem Watson
Publisher:
Cengage Learning
Functions and Change: A Modeling Approach to Coll…
Algebra
ISBN:
9781337111348
Author:
Bruce Crauder, Benny Evans, Alan Noell
Publisher:
Cengage Learning

Algebra and Trigonometry (MindTap Course List)
Algebra
ISBN:
9781305071742
Author:
James Stewart, Lothar Redlin, Saleem Watson
Publisher:
Cengage Learning