ers", as defined by a profe anization, was questioned
Q: A population has µ = 50. Which value of σ would make X = 55 an extreme value out in the tail of the…
A: Given µ = 50 X = 55
Q: A bank has recently acquired a new branch and thus has customers in this new territory. They are…
A: Given that Area A - n1 =200,x1 =20 Area B - n2 =200,x2 =12 Alpha=0.10
Q: Use this table for critical value for correlation coefficients. Critical Values for Correlation…
A: From the provided information, Sample size (n) = 15 Level of significance (α) = 0.01
Q: how did you get 0.45? (part a.)
A: Here x y x2 y2 xy 1 50 1.2 2500 1.44 60 2 100 2.5 10000…
Q: What determines the probability that a person having the disease will yield a positive test? O The…
A: Each prediction model has four measures. They are true positive, true negative, false positive and…
Q: A researcher is interested in finding a 98% confidence interval for the mean number of times per day…
A: Given Mean =X-bar=26.5 Standard deviations=S=19.7 n=97
Q: ess center is interested in finding a 98% confidence interval for the mean number of days week that…
A: Given Mean= 2.1 Standard deviation=2.9
Q: author De Veaux Christensen Thomas Stewart Simmons Alexander Miller Cheeseman Berg Raymond Atkins…
A: Given: n = 14 Formula Used: Correlation coefficient r = n∑XY-∑X∑Yn∑X2-∑X2n∑Y2-∑Y2
Q: 4.12 Height and Weight for Women The figure shows a scatterplot of the heights and weights of some…
A: Given : There is given a scatter plot between two variables height (inches) & Weight (pounds)
Q: The mayor is interested in finding a 90% confidence interval for the mean number of pounds of trash…
A: GIvensample size(n)=177Mean(x)=35.4standard deviation(s)=6.2
Q: A Food Marketing Institute found that 38% of households spend more than $125 a week on groceries.…
A: (a) Obtain the distribution of sample proportion. The distribution of sample proportion is obtained…
Q: A straight line is drawn at random through a point (0, 1) (Figure 22). Find the probability density…
A:
Q: In this exercise, a two-way table is shown for two groups, 1 and 2, and two possible outcomes, A and…
A:
Q: sures income in $10,000 for the 5 (hint: Xx). You decide to random of 11.
A: The distribution for particular type sampling for the structural basis which have the perspective…
Q: hompson Photo Works purchased several new, highly sophisticated processing machines. The production…
A:
Q: 17.1 The probability of an event depends on the random variable X and can be expressed by the…
A:
Q: We wish to estimate what percent of adult residents in a certain county are parents. Out of 600…
A:
Q: is there evidence that the mean life is different from 7520 hours? What is the test statistic?…
A: It is given that Population mean = 7520 Sample mean = 7310 Population standard deviation = 980…
Q: relative risk (risk ratio)
A: A) Relative risk or risk ratio or rate ratio is the ratio of the probability of a particular event…
Q: X 0 1 2 3 P(x) 0.15 0.3 0.05 0.5 Find the standard deviation of this probability distribution. Give…
A: Given probability distribution is X P(X) 0 0.15 1 0.3 2 0.05 3 0.5
Q: Glaucoma is a leading cause of blindness in a certain country. An ophthalmologist measured the…
A: A confidence interval is a numeric value that a researcher will be reasonably confident in and…
Q: f, in a sample of n=25 selected from a normal population, X=58 and S=5, what is your statistical…
A:
Q: A physical fitness association is including the mile run in its secondary-school fitness test. The…
A:
Q: A The regression equation is Y = i + i
A: Use the Excel and Perform the Regression. Followings are the Steps to perform the Regression 1) Open…
Q: You wish to test the following claim (Ha) at a significance level of a = 0.001. Η :μ = 66.8 Ha: μ >…
A: Given information Sample mean M = 74.9 Population mean µ = 66.8 Sample size n = 8 Standard deviation…
Q: The effectiveness of a blood-pressure drug is being investigated. An experimenter finds that, on…
A: Here, x=67.4, s=21.1, and n=28. Here, confidence level is 0.99. Thus, α=0.01=1-0.99.
Q: 7. This includes the means of coming up with the answer and the answer itself. a. Method b. Solution…
A: The following are the solution of the given statements.
Q: a. What is the distribution of X?X - ? @ Please show the following answers to 4 decimal places. b.…
A: Since you have asked multiple questions, we will solve the first question for you. If you want any…
Q: Above answer is incorrect. A population of values has a normal distribution with μ=169μ=169 and…
A: We have given that Mean(µ) = 169Standard deviations (σ) = 72.9 Sample size (n) = 10X ~ N (µ, σ )=…
Q: In his book Outliers, author Malcolm Gladwell argues that more baseball players have birthdates in…
A:
Q: You want to obtain a sample to estimate a population proportion. Based on previous evidence, you…
A: Given Confidence interval 95% Population proportion=67% Error=1.5%
Q: ased on the data shown below, calculate the regression line (each value to at least two decimal…
A: Given Enter above given data in Excel sheet
Q: 3. In the given: 200, 1200, 300, 500, 550, 400, 500, 850, 1300, 2000, 340, 830, and 3000. What is…
A: 3) Mode Mode is defined as the value that is repeatedly occurring in a given set.
Q: 1. Identify the measure of central tendency that is most appropriate to determine the following: The…
A: “Since you have posted multiple questions, we will solve first questionfor you. To get the remaining…
Q: A newsgroup is interested in constructing a 95% confidence interval for the proportion of all…
A: Given X=422 n=575 95% CI
Q: Weight (in kg) 40-44 45-49 50-54 55-59 60-64 65-69 70-74 75-79 Frequency 1 14 15 21 14 10 4 1
A: The given data is Weight(in kg) Frequency 40-44 1 45-49 14 50-54 15 55-59 21 60-64 14…
Q: Why should we be concerned about the presence of confounding variables/factors in statistical…
A: Confounding Variables:- A confounding variable is an that extra variable for which we did not…
Q: The mean daily production of a herd of cows is assumed to be normally distributed with a mean of 35…
A: As per our guidelines we are suppose to answer only one question7)GivenMean(μ)=35standard…
Q: What is the probability of rolling a sum of 99 on a standard pair of six-sided dice? Express your…
A: All possible outcomes when rolling a standard pair of six sided dice are;…
Q: Assume that a sample is used to estimate a population proportion p. Find the 80% confidence interval…
A: Given data n=300 x=189 confidence interval is 80%
Q: Find the class width
A: Given: Time Frequency 15-17 5 18-20 7 21-23 15 24-26 10 27-29 3
Q: If adult female heights are normally distributed, what is the probability that the height of a…
A: A continuous random variable X is said to follow Normal distribution with parameters μ and σ2 if its…
Q: A manufacturer knows that their items have a normally distributed lifespan, with a mean of 5 years,…
A: Given information Population mean µ = 5 years Standard deviation σ = 0.6 years We have given that…
Q: Q5. The sampling distribution of mean is the hypothetical distribution of means from all Possible…
A: Here we have to check whether given statement is true or false "The sampling distribution of mean…
Q: A large sports team claims that, on average, 13000 fans attend a game at their stadium. A company…
A: Given information Sample mean x̅ = 14900 Population mean µ = 13000 Sample size n = 19 Standard…
Q: You want to obtain a sample to estimate a population mean. Based on previous evidence, you believe…
A: Solution-: Given: σ=60.1,M.E.=E=1.5,c=0.90 We want to find n=?
Q: Match each scatterplot shown below with one of the four specifi correlations. Do 88 of a. 0.74 b.…
A: Correlation: If the scatter plot shows a pattern of upward or downward straight line, it means that…
Q: In 1977, men who were under 50 years old had a mean weight of 175 pounds, with a standard deviation…
A: Given: mean(μ)=175standard deviation(σ)=18
Q: What determines the probability that a person having the disease will yield a
A: # Probability that a person having the disease will yield a positive test ?? a): The prevalence b):…
Q: The following frequency table summarizes 60 data values. What is the 3rd quartile of the data?…
A: Given Data Value 1 2 3 4 5 6 7 8 9 10 11 12 13 14 15 16 17 18 19 20 Frequency 5 4 3 1 6…
Urgent help needed with this question please
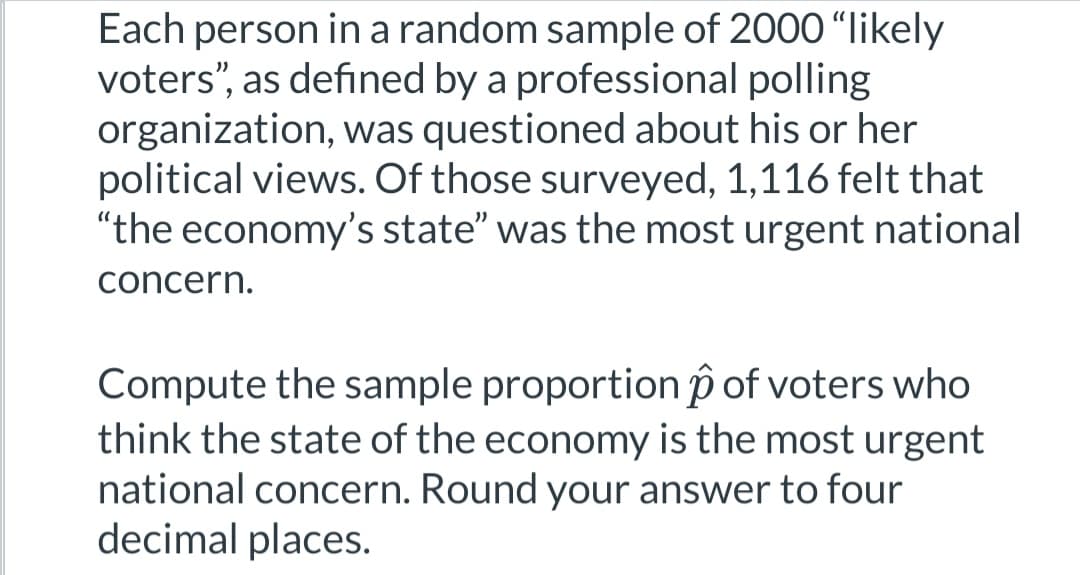
Step by step
Solved in 2 steps