Consider this production function. Study hours 1 4 5. 10 11 12 13 14 15 or more Grade 20 33 42 50 57 63 69 73 78 81 84 86 88 89 90 100, 90 80- 70 6어 50 40 30어 20- 10 3. 2. 23 43 1. 11 1. 2. Hours of study per day Select one or more: а. The average product of labour is falling as hours of study increase. b. The marginal product of labour is constant as hours of study increase. с. The marginal product of labour is rising as hours of study increase. d. The marginal product of labour is zero beyond 15 hours. Final grade 18- 22-
Consider this production function. Study hours 1 4 5. 10 11 12 13 14 15 or more Grade 20 33 42 50 57 63 69 73 78 81 84 86 88 89 90 100, 90 80- 70 6어 50 40 30어 20- 10 3. 2. 23 43 1. 11 1. 2. Hours of study per day Select one or more: а. The average product of labour is falling as hours of study increase. b. The marginal product of labour is constant as hours of study increase. с. The marginal product of labour is rising as hours of study increase. d. The marginal product of labour is zero beyond 15 hours. Final grade 18- 22-

Principles of Economics 2e
2nd Edition
ISBN:9781947172364
Author:Steven A. Greenlaw; David Shapiro
Publisher:Steven A. Greenlaw; David Shapiro
Chapter34: Globalization And Protectionism
Section: Chapter Questions
Problem 43CTQ: How can governments identify good candidates for infant industry protection? Can you suggest some...

Related questions
Question
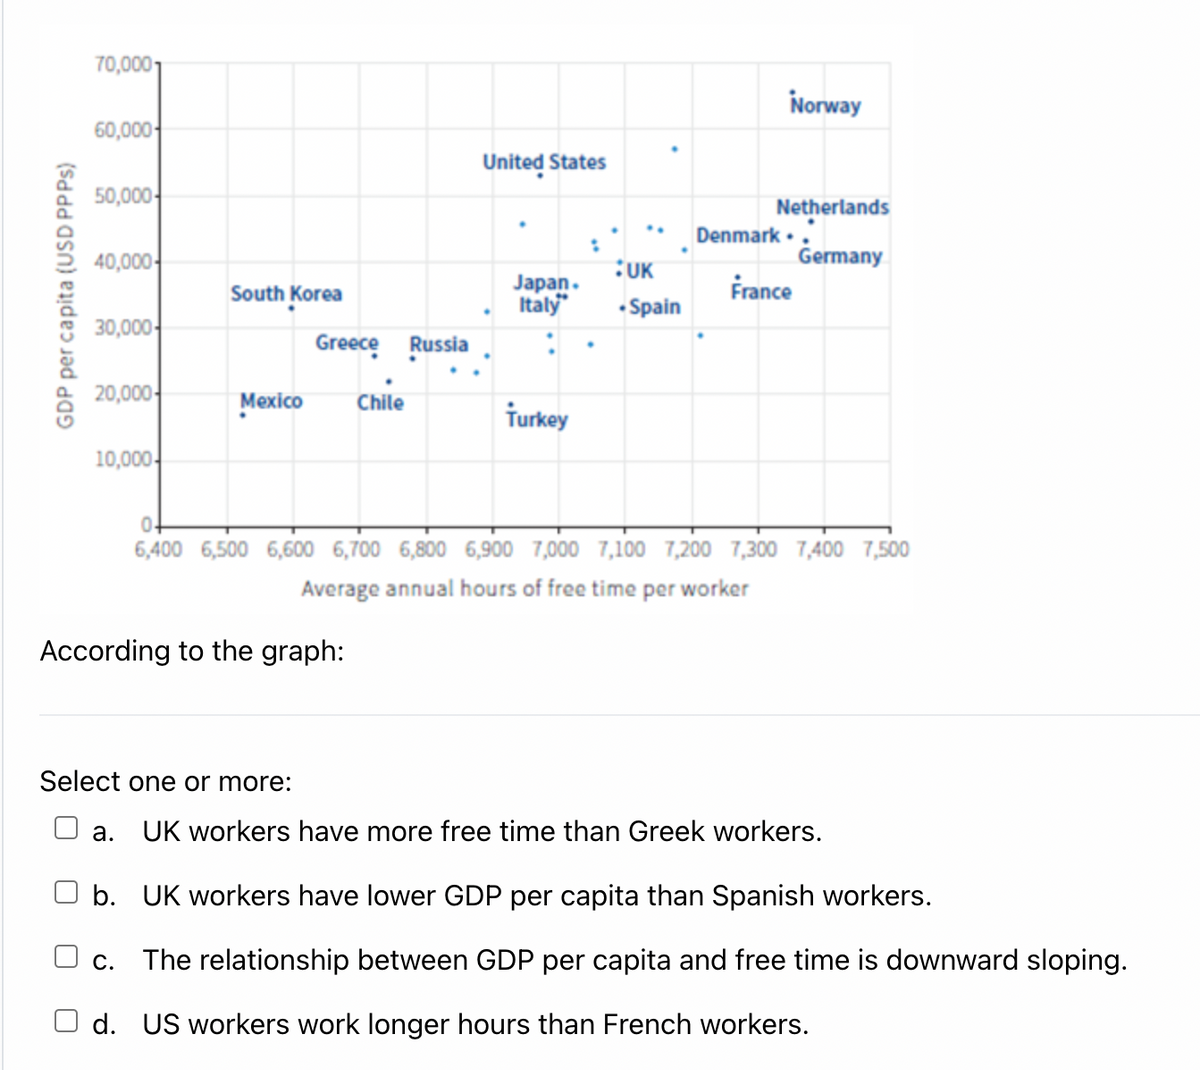
Transcribed Image Text:70,0001
Norway
60,000
United States
50,000-
Netherlands
Denmark •.
Germany
France
40,000-
:UK
South Korea
Jарan.
Italy"
• Spain
30,000-
Greece Russia
20,000-
Mexico
Chile
Turkey
10,000-
0.
6,400 6,500 6,600 6,700 6,800 6,900 7,000 7,100 7,200 7,300 7,400 7,500
Average annual hours of free time per worker
According to the graph:
Select one or more:
а.
UK workers have more free time than Greek workers.
b. UK workers have lower GDP per capita than Spanish workers.
O c. The relationship between GDP per capita and free time is downward sloping.
d. US workers work longer hours than French workers.
GDP per capita (USD PPPS)
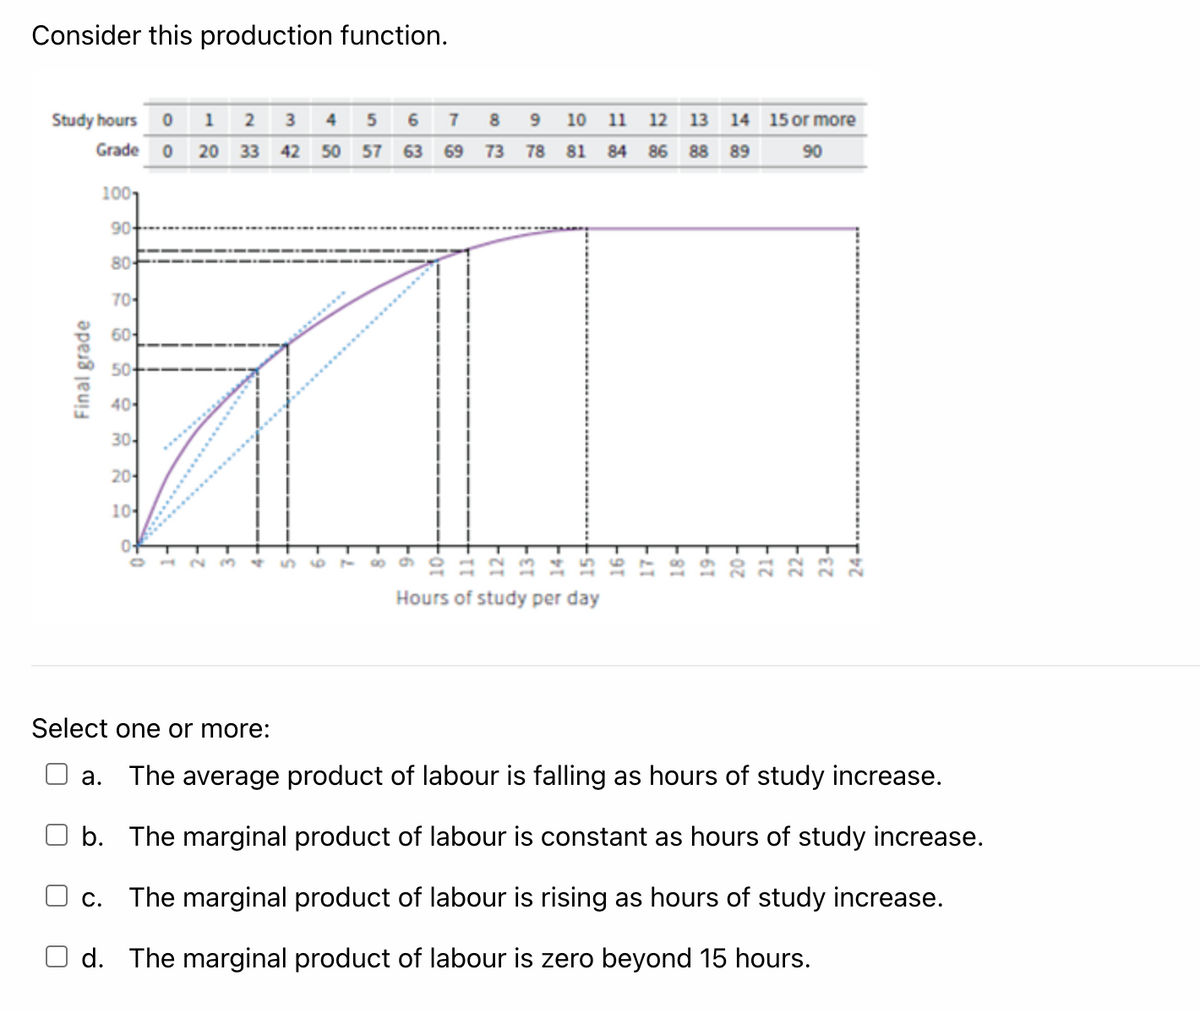
Transcribed Image Text:Consider this production function.
Study hours
1 2
8 9 10 11 12
15 or more
4
5
6.
13
14
Grade
20
33
42
50
57
63
69 73 78 81 84 86 88 89
90
1001
90+
80-
70어
60-
50+
40
30어
20어
10-
3)
1.
1.
2)
1.
Hours of study per day
Select one or more:
The average product of labour is falling as hours of study increase.
а.
b.
The marginal product of labour is constant as hours of study increase.
The marginal product of labour is rising as hours of study increase.
C.
d. The marginal product of labour is zero beyond 15 hours.
Final grade
-2-
22-
Expert Solution
This question has been solved!
Explore an expertly crafted, step-by-step solution for a thorough understanding of key concepts.

Step by step
Solved in 2 steps

Knowledge Booster


Learn more about
Need a deep-dive on the concept behind this application? Look no further. Learn more about this topic, economics and related others by exploring similar questions and additional content below.Recommended textbooks for you
Principles of Economics 2e
Economics
ISBN:
9781947172364
Author:
Steven A. Greenlaw; David Shapiro
Publisher:
OpenStax

Principles of Economics 2e
Economics
ISBN:
9781947172364
Author:
Steven A. Greenlaw; David Shapiro
Publisher:
OpenStax