Construct a flowchart for the module that generates distribution of frequencies of grades to illustrate the execution flow of the process.
Construct a flowchart for the module that generates distribution of frequencies of grades to illustrate the execution flow of the process.

Computer Networking: A Top-Down Approach (7th Edition)
7th Edition
ISBN:9780133594140
Author:James Kurose, Keith Ross
Publisher:James Kurose, Keith Ross
Chapter1: Computer Networks And The Internet
Section: Chapter Questions
Problem R1RQ: What is the difference between a host and an end system? List several different types of end...

Related questions
Question
Transcribed Image Text:A university is analysing students' academic performance in a course using an application. As
shown below, the application generates a list of final marks and an academic performance
report:
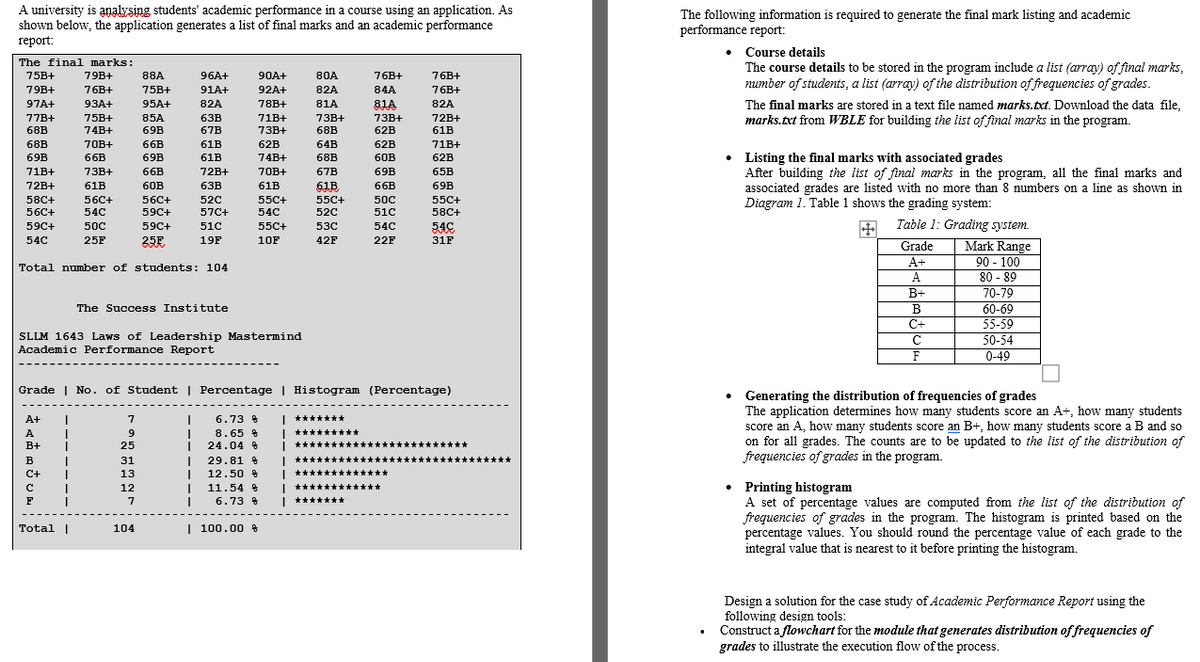
The following information is required to generate the final mark listing and academic
performance report:
Course details
The course details to be stored in the program include a list (array) of final marks,
number of students, a list (array) of the distribution of frequencies of grades.
The final marks:
75B+
79B+
88A
96A+
90A+
80A
76B+
76B+
79B+
76B+
75B+
91A+
92A+
82A
84A
76B+
97A+
93A+
95A+
82A
78B+
81A
81A
82A
The final marks are stored in a text file named marks.txt. Download the data file,
marks.txt from WBLE for building the list of final marks in the program.
77B+
75B+
85A
63B
71B+
73B+
73B+
72B+
68B
74B+
69B
67B
73B+
68B
62B
61B
68B
70B+
66B
61B
62B
64B
62B
71B+
• Listing the final marks with associated grades
After building the list of final marks in the program, all the final marks and
associated grades are listed with no more than 8 numbers on a line as shown in
Diagram 1. Table 1 shows the grading system:
69B
66B
69B
61B
74B+
68B
60B
62B
71B+
73B+
66B
72B+
70B+
67B
69B
65B
72B+
61B
60B
63B
61B
61B
66B
69B
58C+
56C+
56C+
520
55C+
55C+
50C
55C+
56C+
54C
59C+
57C+
54C
520
510
58C+
+ Table 1: Grading system.
Mark Range
90 - 100
80 - 89
70-79
59C+
500
59C+
51C
55C+
53C
54C
54C
54C
25F
25E
19F
10F
42F
22F
31F
Grade
A+
Total number of students: 104
A
B+
60-69
55-59
50-54
The Success Institute
B
C+
SLLM 1643 Laws of Leadership Mastermind
Academic Performance Report
C
F
0-49
Grade | No. of Student | Percentage | Histogram (Percentage)
Generating the distribution of frequencies of grades
The application determines how many students score an A+, how many students
score an A, how many students score an B+, how many students score a B and so
on for all grades. The counts are to be updated to the list of the distribution of
frequencies of grades in the program.
A+
7
6.73
| *******
A
9
8.65 %
| ***
B+
25
24.04 4
B
31
29.81 *
C+
13
12.50 4
• Printing histogram
A set of percentage values are computed from the list of the distribution of
frequencies of grades in the program. The histogram is printed based on the
percentage values. You should round the percentage value of each grade to the
integral value that is nearest to it before printing the histogram.
12
11.54 %
F
6.73 %
I*******
Total |
104
| 100.00
Design a solution for the case study of Academic Performance Report using the
following design tools:
Construct a flowchart for the module that generates distribution of frequencies of
grades to illustrate the execution flow of the process.
Expert Solution
This question has been solved!
Explore an expertly crafted, step-by-step solution for a thorough understanding of key concepts.

Step by step
Solved in 4 steps with 1 images

Recommended textbooks for you
Computer Networking: A Top-Down Approach (7th Edi…
Computer Engineering
ISBN:
9780133594140
Author:
James Kurose, Keith Ross
Publisher:
PEARSON

Computer Organization and Design MIPS Edition, Fi…
Computer Engineering
ISBN:
9780124077263
Author:
David A. Patterson, John L. Hennessy
Publisher:
Elsevier Science

Network+ Guide to Networks (MindTap Course List)
Computer Engineering
ISBN:
9781337569330
Author:
Jill West, Tamara Dean, Jean Andrews
Publisher:
Cengage Learning
Computer Networking: A Top-Down Approach (7th Edi…
Computer Engineering
ISBN:
9780133594140
Author:
James Kurose, Keith Ross
Publisher:
PEARSON
Computer Organization and Design MIPS Edition, Fi…
Computer Engineering
ISBN:
9780124077263
Author:
David A. Patterson, John L. Hennessy
Publisher:
Elsevier Science
Network+ Guide to Networks (MindTap Course List)
Computer Engineering
ISBN:
9781337569330
Author:
Jill West, Tamara Dean, Jean Andrews
Publisher:
Cengage Learning

Concepts of Database Management
Computer Engineering
ISBN:
9781337093422
Author:
Joy L. Starks, Philip J. Pratt, Mary Z. Last
Publisher:
Cengage Learning

Prelude to Programming
Computer Engineering
ISBN:
9780133750423
Author:
VENIT, Stewart
Publisher:
Pearson Education

Sc Business Data Communications and Networking, T…
Computer Engineering
ISBN:
9781119368830
Author:
FITZGERALD
Publisher:
WILEY