Construct a frequency table for the follwing data. The example of the table is shown below.
Construct a frequency table for the follwing data. The example of the table is shown below.

Glencoe Algebra 1, Student Edition, 9780079039897, 0079039898, 2018
18th Edition
ISBN:9780079039897
Author:Carter
Publisher:Carter
Chapter10: Statistics
Section10.6: Summarizing Categorical Data
Problem 33PPS

Related questions
Question
100%
Construct a frequency table for the follwing data. The example of the table is shown below.
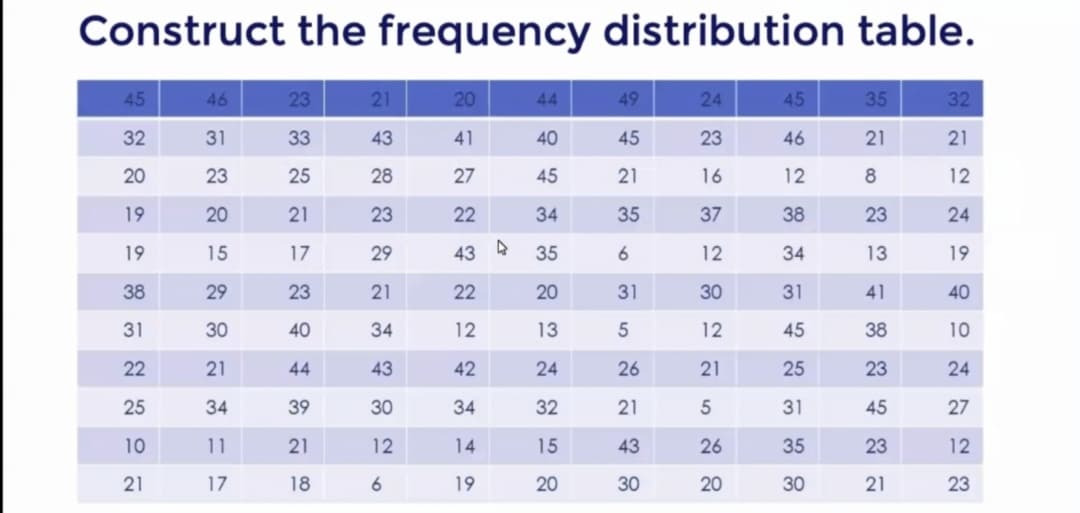
Transcribed Image Text:Construct the frequency distribution table.
45
46
23
21
20
44
49
24
45
35
32
32
31
33
43
41
40
45
23
46
21
21
20
23
25
28
27
45
21
16
12
12
19
20
21
23
22
34
35
37
38
23
24
19
15
17
29
43 A
35
12
34
13
19
38
29
23
21
22
20
31
30
31
41
40
31
30
40
34
12
13
12
45
38
10
22
21
44
43
42
24
26
21
25
23
24
25
34
39
30
34
32
21
31
45
27
10
11
21
12
14
15
43
26
35
23
12
21
17
18
19
20
30
20
30
21
23
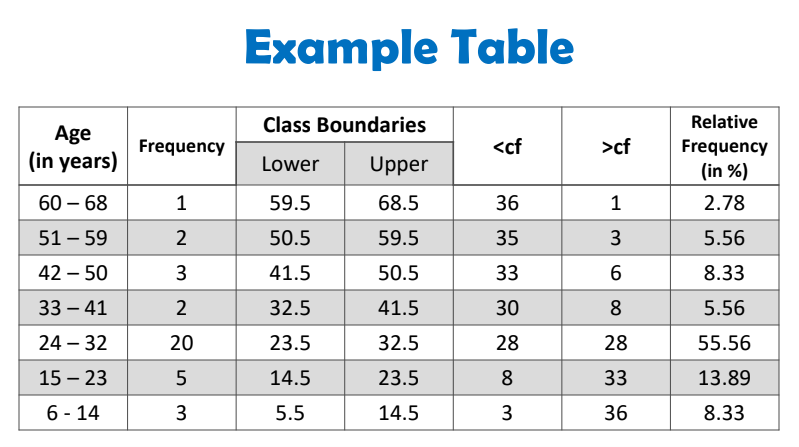
Transcribed Image Text:Example Table
Class Boundaries
Relative
Age
(in years)
Frequency
<cf
>cf
Frequency
(in %)
Lower
Upper
60 – 68
1
59.5
68.5
36
1
2.78
51 – 59
50.5
59.5
35
3
5.56
42 – 50
3
41.5
50.5
33
6
8.33
33 – 41
2
32.5
41.5
30
8
5.56
24 – 32
20
23.5
32.5
28
28
55.56
15 – 23
14.5
23.5
8
33
13.89
6 - 14
3
5.5
14.5
36
8.33
3.
2.
Expert Solution
This question has been solved!
Explore an expertly crafted, step-by-step solution for a thorough understanding of key concepts.

Step by step
Solved in 2 steps

Recommended textbooks for you
Glencoe Algebra 1, Student Edition, 9780079039897…
Algebra
ISBN:
9780079039897
Author:
Carter
Publisher:
McGraw Hill
Glencoe Algebra 1, Student Edition, 9780079039897…
Algebra
ISBN:
9780079039897
Author:
Carter
Publisher:
McGraw Hill