r each of the 4 groups are presented below: Std. Deviation can Std. Error 080 .4324 .1934 680 3768 .1685 560 3362 1503 080 2387 1068 850 .4033 .0902
r each of the 4 groups are presented below: Std. Deviation can Std. Error 080 .4324 .1934 680 3768 .1685 560 3362 1503 080 2387 1068 850 .4033 .0902

College Algebra (MindTap Course List)
12th Edition
ISBN:9781305652231
Author:R. David Gustafson, Jeff Hughes
Publisher:R. David Gustafson, Jeff Hughes
Chapter8: Sequences, Series, And Probability
Section8.7: Probability
Problem 58E: What is meant by the sample space of an experiment?

Related questions
Question
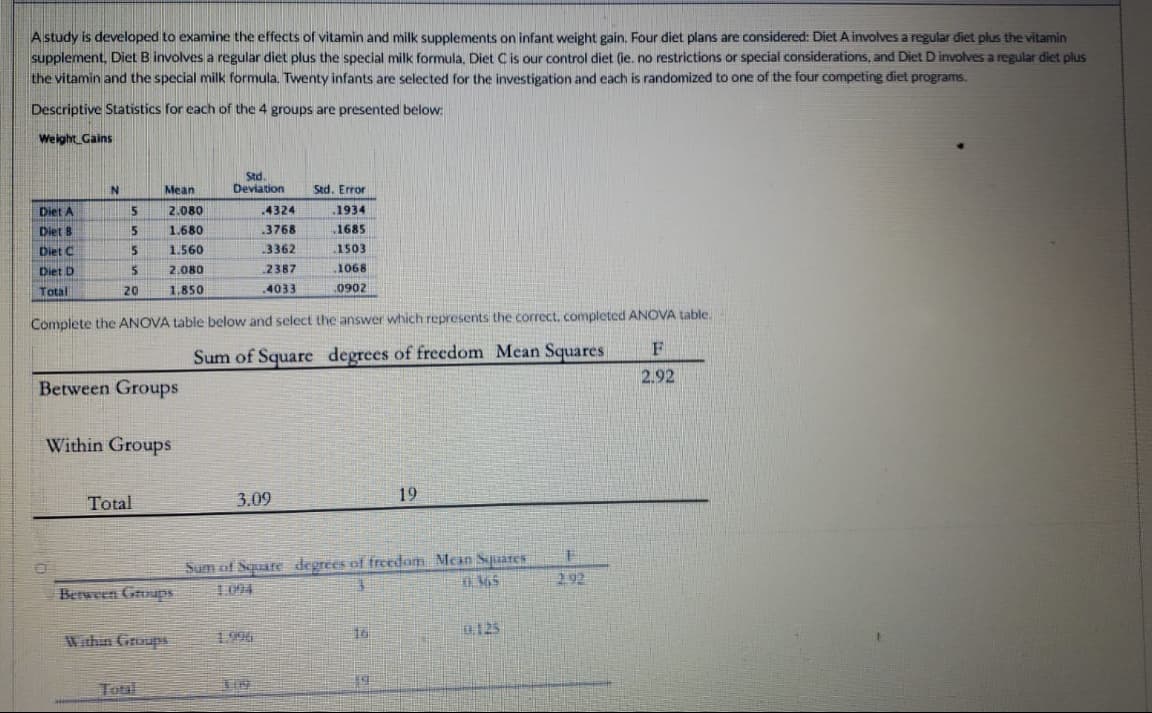
Transcribed Image Text:A study is developed to examine the effects of vitamin and milk supplements on infant weight gain. Four diet plans are considered: Diet A involves a regular diet plus the vitamin
supplement, Diet B involves a regular diet plus the special milk formula, Diet Cis our control diet (ie. no restrictions or special considerations, and Diet D involves a regular diet plus
the vitamin and the special milk formula. Twenty infants are selected for the investigation and each is randomized to one of the four competing diet programs.
Descriptive Statistics for each of the 4 groups are presented below:
Weight Gains
m
Std
Deviation
Mean
Std. Error
Diet A
2.080
.4324
.1934
Diet B
1.680
.3768
1685
Diet C
1.560
3362
.1503
Diet D
2.080
2387
.1068
Total
20
1.850
.4033
0902
Complete the ANOVA table below and select the answer which represents the correct. completed ANOVA table.
F
Sum of Square degrees of freedom Mean Squares
2.92
Between Groups
Within Groups
Total
3.09
19
Sum of Square degrees of freedom Mean Squares
292
Berween Groups
1094
Within Groups
1.996
16
u125
Total
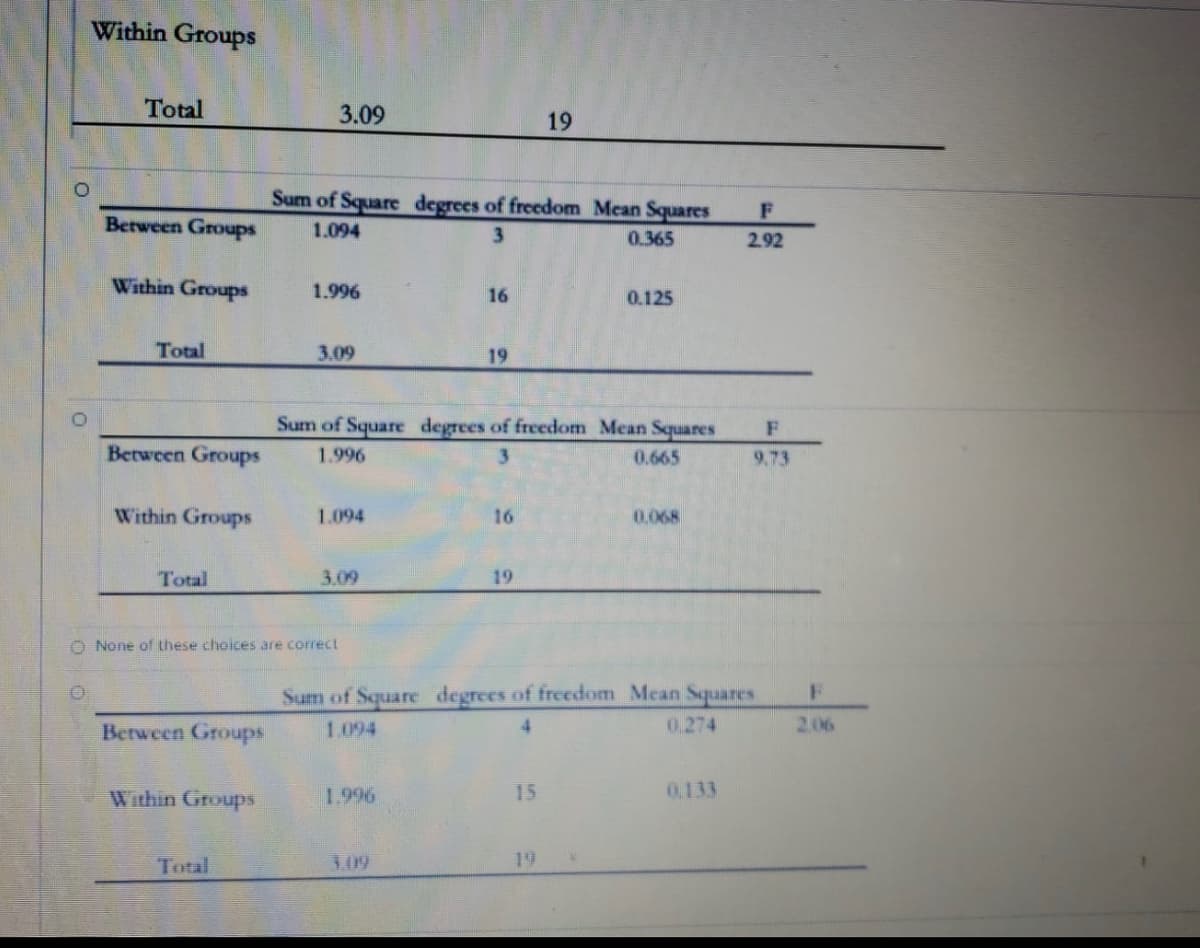
Transcribed Image Text:Within Groups
Total
3.09
19
Sum of Square degrees of freedom Mean Squares
F
Berween Groups
1.094
3
0.365
2.92
Within Groups
1.996
16
0.125
Total
3.09
19
Sum of Square degrees of freedom Mean Squares
Between Groups
1.996
0.665
9.73
Within Groups
1.094
16
0.068
Total
3.09
19
O None of these choices are correct
Sum of Square degrees of freedom Mean Squaries
F
Between Groups
1.094
4.
0.274
2.06
Within Groups
1.996
15
0,133
Total
3.09
19
Expert Solution
This question has been solved!
Explore an expertly crafted, step-by-step solution for a thorough understanding of key concepts.

Step by step
Solved in 3 steps with 3 images

Recommended textbooks for you
College Algebra (MindTap Course List)
Algebra
ISBN:
9781305652231
Author:
R. David Gustafson, Jeff Hughes
Publisher:
Cengage Learning

College Algebra (MindTap Course List)
Algebra
ISBN:
9781305652231
Author:
R. David Gustafson, Jeff Hughes
Publisher:
Cengage Learning