Construct the following 1. a frequency distribution 2. a relative frequency distribution 3. a histogram a frequency polygon
Construct the following 1. a frequency distribution 2. a relative frequency distribution 3. a histogram a frequency polygon

Linear Algebra: A Modern Introduction
4th Edition
ISBN:9781285463247
Author:David Poole
Publisher:David Poole
Chapter4: Eigenvalues And Eigenvectors
Section4.6: Applications And The Perron-frobenius Theorem
Problem 22EQ

Related questions
Question
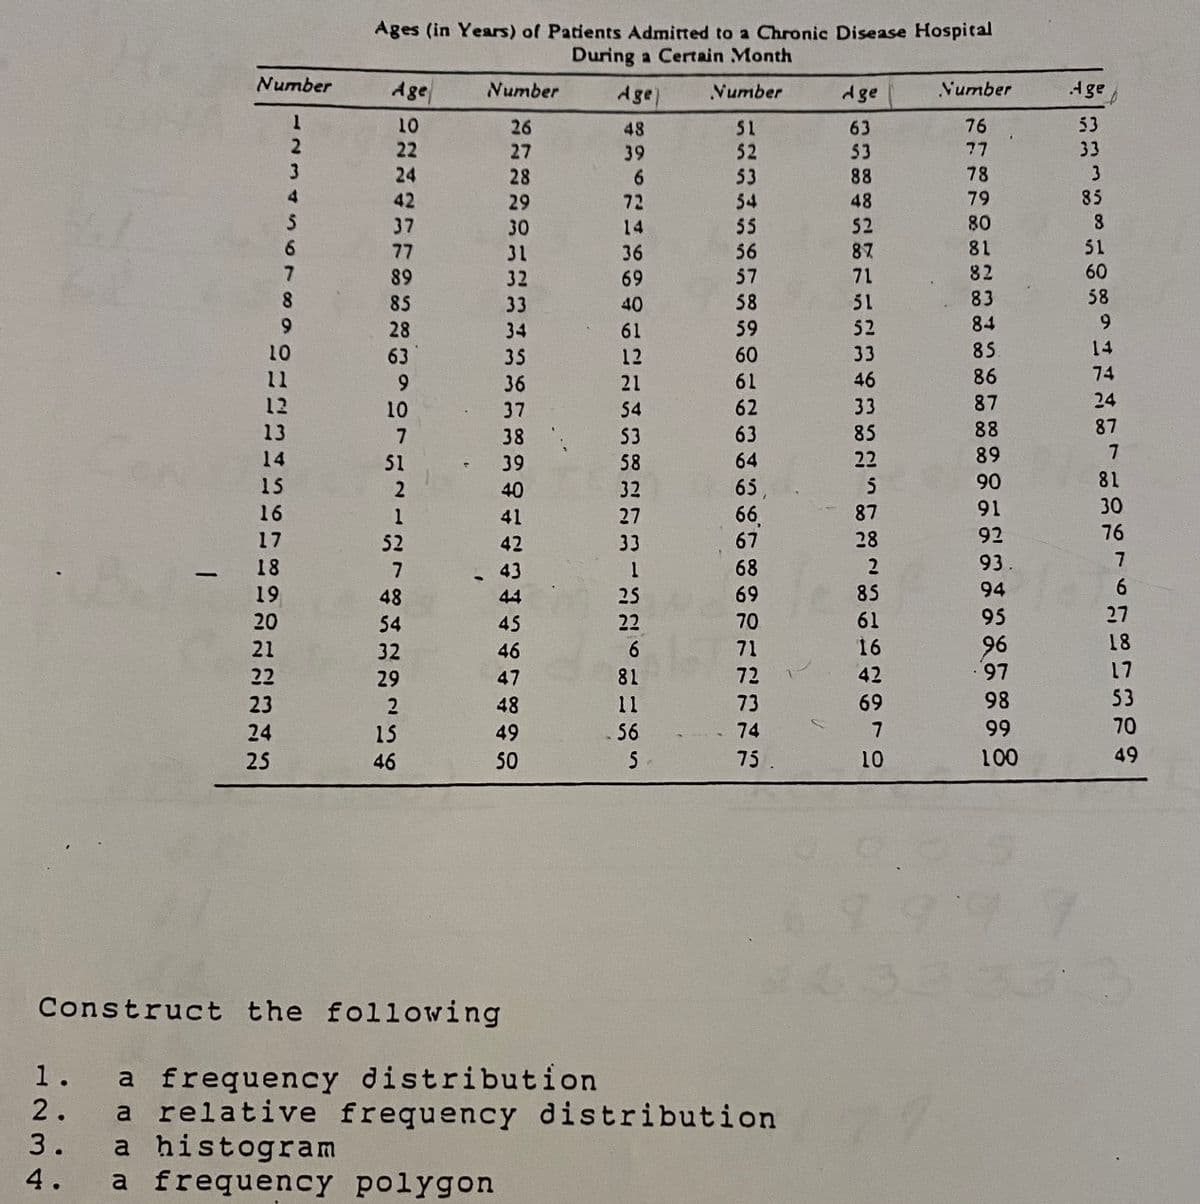
Transcribed Image Text:Ages (in Years) of Patients Admitted to a Chronic Disease Hospital
During a Certain Month
Number
Age
Number
dge)
Vumber
dge
Vumber
A ge
10
26
48
51
63
76
53
22
77
33
52
53
27
39
53
3
85
24
28
6.
88
78
42
29
72
54
48
79
37
30
14
55
52
80
6.
81
51
56
57
77
31
36
87
7
89
32
69
71
82
60
8.
85
33
40
58
51
83
58
28
34
61
59
52
84
9.
10
63
35
12
60
33
85
14
11
9.
36
21
61
46
86
74
12
10
37
54
62
33
87
24
87
88
89
13
7
38
53
63
85
14
51
39
58
64
22
15
2
40
32
65
90
81
30
16
92
16
87
66,
67
41
27
17
52
42
33
28
76
18
7
43
68
2
93.
|
19
48
44
25
69
85
94
6.
20
54
45
22
70
61
95
27
18
96
·97
21
32
46
6.
71
16
22
29
47
81
72
42
17
23
48
11
73
69
98
53
70
66
100
24
15
49
56
74
25
46
50
75.
10
49
4.3333
Construct the following
a frequency distribution
a relative frequency distribution
a histogram
a frequency polygon
1.
2.
3.
4.
Expert Solution
This question has been solved!
Explore an expertly crafted, step-by-step solution for a thorough understanding of key concepts.

This is a popular solution!

Trending now
This is a popular solution!

Step by step
Solved in 4 steps with 4 images

Recommended textbooks for you
Linear Algebra: A Modern Introduction
Algebra
ISBN:
9781285463247
Author:
David Poole
Publisher:
Cengage Learning

Functions and Change: A Modeling Approach to Coll…
Algebra
ISBN:
9781337111348
Author:
Bruce Crauder, Benny Evans, Alan Noell
Publisher:
Cengage Learning
Linear Algebra: A Modern Introduction
Algebra
ISBN:
9781285463247
Author:
David Poole
Publisher:
Cengage Learning
Functions and Change: A Modeling Approach to Coll…
Algebra
ISBN:
9781337111348
Author:
Bruce Crauder, Benny Evans, Alan Noell
Publisher:
Cengage Learning