Construct a categorical frequency distribution for the data. Class Frequency Caramel Hazelnut Mocha Plain Vanilla
Construct a categorical frequency distribution for the data. Class Frequency Caramel Hazelnut Mocha Plain Vanilla

Glencoe Algebra 1, Student Edition, 9780079039897, 0079039898, 2018
18th Edition
ISBN:9780079039897
Author:Carter
Publisher:Carter
Chapter10: Statistics
Section10.6: Summarizing Categorical Data
Problem 10CYU

Related questions
Question
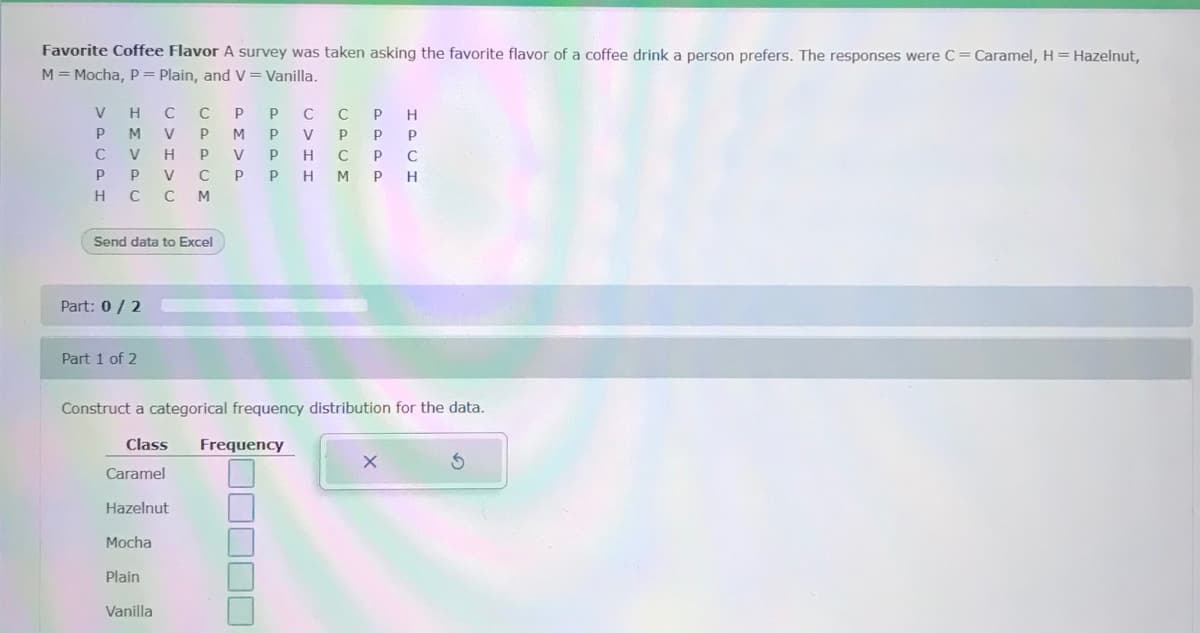
Transcribed Image Text:Favorite Coffee Flavor A survey was taken asking the favorite flavor of a coffee drink a person prefers. The responses were C= Caramel, H = Hazelnut,
M = Mocha, P = Plain, and V= Vanilla.
H
C
P
H
P
V
M
P
V
P
P
H
V
C
V
P
H.
M P
H.
C C
Send data to Excel
Part: 0 / 2
Part 1 of 2
Construct a categorical frequency distribution for the data.
Class
Frequency
Caramel
Hazelnut
Mocha
Plain
Vanilla
Expert Solution
This question has been solved!
Explore an expertly crafted, step-by-step solution for a thorough understanding of key concepts.

Step by step
Solved in 2 steps with 1 images

Knowledge Booster


Learn more about
Need a deep-dive on the concept behind this application? Look no further. Learn more about this topic, statistics and related others by exploring similar questions and additional content below.Recommended textbooks for you
Glencoe Algebra 1, Student Edition, 9780079039897…
Algebra
ISBN:
9780079039897
Author:
Carter
Publisher:
McGraw Hill
Glencoe Algebra 1, Student Edition, 9780079039897…
Algebra
ISBN:
9780079039897
Author:
Carter
Publisher:
McGraw Hill