Construct the indicated confidence interval for the difference between the two population means. Assume that the assumptions and conditions for inference have been met. A researcher was interested in comparing the number of hours of television watched each day by two-year-olds and three-year-olds. A random sample of 18 two-year-olds and 18 three-year-olds yielded the following data: 2-year-olds 0.5 1.5 3-year-olds 2.0 3.0 1.5 2.0 1.5 1.5 1.5 1.0 0.0 1.5 2.0 1.0 1.0 0.0 2.0 1.5 0.0 1.5 2.5 2.0 1.5 2.0 0.5 0.0 2.5 2.0 1.5 2.5 0.0 3.0 1.0 0.5 1.0 1.5 Determine a 99% confidence interval for the difference, u - Han between the mean of two-year-olds' TV watching and the mean GPA of three-year-olds' TV watching. O A. (-1.14, 0.53) O B. (-1.26, 0.65) OC. (-1.16, 0.55) O D. (-1.06, 0.45) O E. (-0.98, 0.37)
Construct the indicated confidence interval for the difference between the two population means. Assume that the assumptions and conditions for inference have been met. A researcher was interested in comparing the number of hours of television watched each day by two-year-olds and three-year-olds. A random sample of 18 two-year-olds and 18 three-year-olds yielded the following data: 2-year-olds 0.5 1.5 3-year-olds 2.0 3.0 1.5 2.0 1.5 1.5 1.5 1.0 0.0 1.5 2.0 1.0 1.0 0.0 2.0 1.5 0.0 1.5 2.5 2.0 1.5 2.0 0.5 0.0 2.5 2.0 1.5 2.5 0.0 3.0 1.0 0.5 1.0 1.5 Determine a 99% confidence interval for the difference, u - Han between the mean of two-year-olds' TV watching and the mean GPA of three-year-olds' TV watching. O A. (-1.14, 0.53) O B. (-1.26, 0.65) OC. (-1.16, 0.55) O D. (-1.06, 0.45) O E. (-0.98, 0.37)

Glencoe Algebra 1, Student Edition, 9780079039897, 0079039898, 2018
18th Edition
ISBN:9780079039897
Author:Carter
Publisher:Carter
Chapter4: Equations Of Linear Functions
Section: Chapter Questions
Problem 8SGR

Related questions
Topic Video
Question
100%
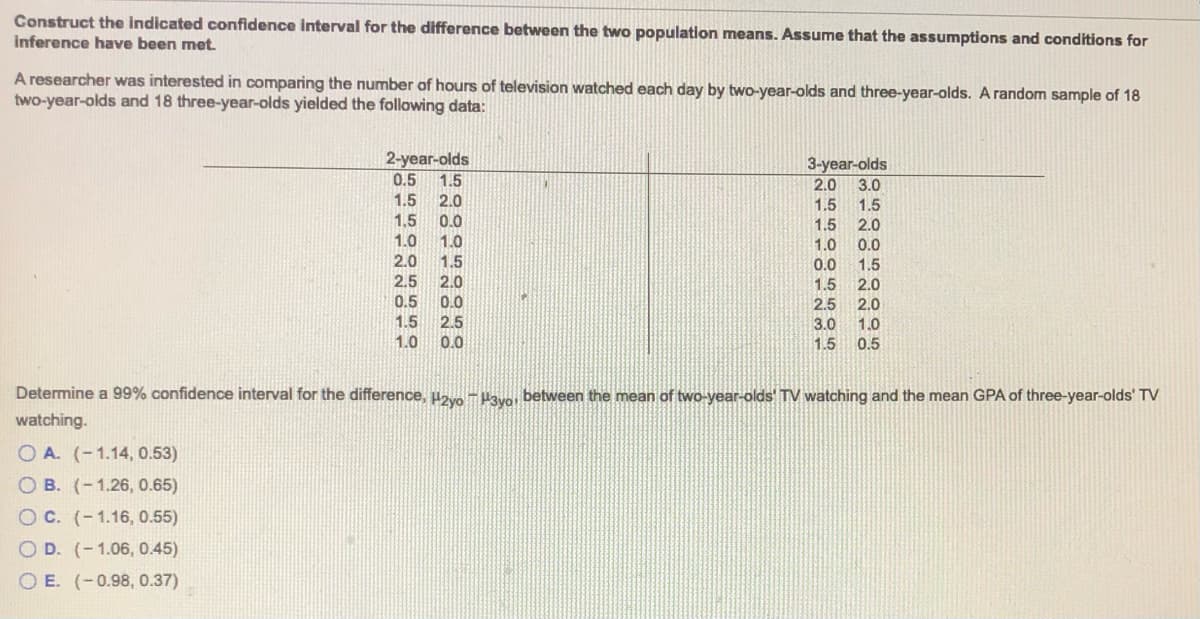
Transcribed Image Text:Construct the indicated confidence interval for the difference between the two population means. Assume that the assumptions and conditions for
inference have been met.
A researcher was interested in comparing the number of hours of television watched each day by two-year-olds and three-year-olds. A random sample of 18
two-year-olds and 18 three-year-olds yielded the following data:
2-year-olds
0.5
3-year-olds
3.0
1.5
2.0
1.5
1.5
2.0
1.5
1,5
1.0
0.0
1.5
2.0
1.0
1.0
0.0
2.0
1.5
0.0
1.5
2.5
2.0
1.5
2.0
0.5
0.0
2.5
3.0
2.0
1.5
2.5
1.0
0.5
1.0
0.0
1.5
Determine a 99% confidence interval for the difference, u Hav between the mean of two-year-olds' TV watching and the mean GPA of three-year-olds' TV
watching.
O A. (-1.14, 0.53)
O B. (-1.26, 0.65)
O C. (-1.16, 0.55)
O D. (-1.06, 0.45)
O E. (-0.98, 0.37)
Expert Solution
This question has been solved!
Explore an expertly crafted, step-by-step solution for a thorough understanding of key concepts.

This is a popular solution!

Trending now
This is a popular solution!

Step by step
Solved in 2 steps with 30 images

Knowledge Booster


Learn more about
Need a deep-dive on the concept behind this application? Look no further. Learn more about this topic, statistics and related others by exploring similar questions and additional content below.Recommended textbooks for you
Glencoe Algebra 1, Student Edition, 9780079039897…
Algebra
ISBN:
9780079039897
Author:
Carter
Publisher:
McGraw Hill

College Algebra (MindTap Course List)
Algebra
ISBN:
9781305652231
Author:
R. David Gustafson, Jeff Hughes
Publisher:
Cengage Learning
Glencoe Algebra 1, Student Edition, 9780079039897…
Algebra
ISBN:
9780079039897
Author:
Carter
Publisher:
McGraw Hill
College Algebra (MindTap Course List)
Algebra
ISBN:
9781305652231
Author:
R. David Gustafson, Jeff Hughes
Publisher:
Cengage Learning