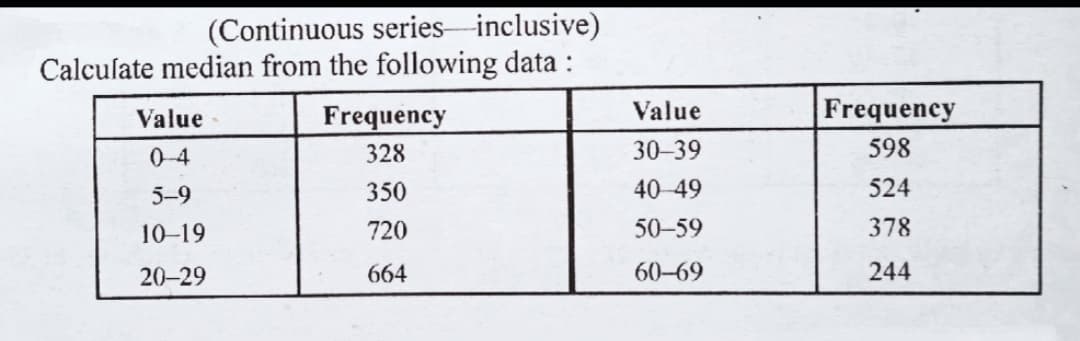
(Continuous series-inclusive) Calculate median from the following data : Value Frequency Value Frequency 0-4 328 30-39 598 5-9 350 40 49 524 10-19 720 50-59 378 20-29 664 60-69 244


Q: -what proportion of samples break during shipment?
A: HERE DEFINE EVENTS break during transit = B shipped in large packages =L shipped in small packages ...
Q: The proportion of households with pets is estimated to be 85% The proportion of 200 investigated hou...
A: Given that The proportion of households with pets is estimated to be 85% = P = 0.85 Sample size (n)...
Q: 1. A genetic experiment with peas resulted in one sampling of offspring that consisted of 442 green ...
A: 1)a)Givenn=442x=156p^=xn=156442=0.3529Confidence interval = 95%
Q: The following are the marks obtained by a batch of 9 students in a certain test: SI. No. Marks S1. N...
A:
Q: In a professional exam with several hundred candidates the following summary scores were reported. P...
A: We are given the following information on scores as follows : Percentile Score 10% 220 25% 24...
Q: Understanding Key Terms: Use the word bank below complete each statement in the following paragraphs...
A: Given that, a group of psychologists plan to administer an inventory designed to measure the self-es...
Q: If 30% of the bolts produced by a machine are defective, determine the probability that out of 4 bol...
A:
Q: Direction: Solve the problem by using Pearson rand follow the steps shown in Day 3 example. NOTE: Th...
A: We have given that, X :- 5, 7, 9, 10, 11, 12, 15, 17, 20, 25 Y:- 6, 15, 16, 12, 21, 22, 8, 27, 5, 3...
Q: The random variables X and Y have joint probability density function f(x, y) = { c(x + xy), 0 <x < 4...
A:
Q: 1. Find the critical value using the Chi-Square Table for a = 0.01, n = 19, right- tailed. %3D
A: Givenα=0.01n=19
Q: 2. Find the critical value using the Chi-Square Table for a tailed. 0.10, n 7, two- %3D %3D
A: We have given that, Sample size (n ) = 7 and significance level (α) = 0.10 Then, We will find...
Q: The lengths of a professor's classes has a continuous uniform distribution between 50.0 min and 52.0...
A:
Q: In 2006, the average household debt service ratio for homeowners was 14.35. The household debt servi...
A: Use the One Sample Z test Calculate Sample Mean and Standard deviation Using Excel
Q: $ 20. Calculate the standard deviation from the following data : Size of item Frequency Size of item...
A: size of items (x) Frequency (f) f⋅x f⋅x2 6 3 18 108 7 6 42 294 8 9 72 576 9 13 117 1053...
Q: 6. Calculate Coefficient of Correlation between the values of X and Y given below : Values of X: 65 ...
A:
Q: The following table shows the frequency of outcomes when two distinguishable coins were tossed 4,000...
A:
Q: The independent RVs X and Y have distributions N(45, 2) and N(44, 1.5) respec. tively. What is the p...
A:
Q: "Prove that the value of x for the 2 × 2 contingency table a b is given by N(ad-bc)? (a+b)(c+d)(a+c)...
A:
Q: para- If the time T to failure of a component follows a Weibull distribution with imeters a and B, f...
A:
Q: Illustration 10. From the following data compute a quantity index : Commodity Quantity Price in 1994...
A:
Q: A bar offers alcoholic and non-alcoholic beverages. They have 12 alcoholic beverages that cost $10 o...
A: GivenNo.of alcoholic beverages that cost $10 or more = 12No. of alcoholic beverages that cost less t...
Q: Testing for a Linear Correlation. In Exercises 13–28, construct a scatterplot, and find the value of...
A: Diameter (x) Circumference (y) xy x2 y2 7.4 23.2 171.68 54.76 538.24 23.9 75.1 1794.89 571.21 56...
Q: Taxpayers who go to a treasury office to pay their contributions complain that they wait more than 7...
A:
Q: 2. Random samples of size n = 2 are drawn from a finite population consisting of the numbers 1,3,5, ...
A:
Q: Find the value of the median from the following data : 17, 15, 24, 30, 11 10, 18, 9,
A:
Q: A particular fruit's weights are normally distributed, with a mean of 752 grams and a standard devia...
A: Let X be the random variable from normal distribution with mean (μ) = 752 and standard deviation (σ)...
Q: Assume that z-scores are normally distributed with a mean of 0 and a standard deviation of 1. If P(...
A: Let Z-score are normally distributed with mean = 0 and standard deviation = 2 Then, We will find va...
Q: Compute standard deviation and its coefficient from the following data: - -10 10-15 15-20 20-30 30- ...
A:
Q: For a bivariate distribution, the lines of regression are 3X + 12Y = 19; 3Y+9X 46 Find the means and...
A: Given a bivariate distribution, the line of regression are: 3X +12Y = 19 ; 3Y + 9X = 46 We need to ...
Q: A random sample of size n is taken from a general Gamma (Erlang) distribution with parameters 1 and ...
A:
Q: 8; (A) 18, (aß) = 5 and N = 35. 16. For two attributes A and B, we have (AB) Calculate the coefficie...
A:
Q: 22) A basket contains five apples, four peaches, and five pears. You randomly select and eat three p...
A: Given,no.of apples=5no.of peaches=4no.of pears=5Total no.of fruits=14
Q: Find the area under the Standard Normal Distribution to the left of Z = 1.28.___________ Find the a...
A: We have given that. X~N( 0, 1) μ = 0, ? =1 Z-score =( x - μ )/?
Q: 11. Find out the likely production corresponding to a rainfall of 40 cms. from the following data: R...
A: Given The data is as follows: Rainfall (in cms.) Output (in quintals) Average 30 50 S.D 5 1...
Q: . Find R ^ 2 and interpret it in context . Round to the hundredth percent .
A: Given from table Correlation=R=0.7088847
Q: Q. 1.1 Let X1,.,X10 * B(1,0). Let Ho : 60 = | and H1 : 0 = . We reject Ho if S = E X; < 3. Find the ...
A: Given that We have to find the power function of test :
Q: what are the odds that all six of them have a pet?
A: here total household = 125 million total household have pet = 86 million
Q: The horsepower (Y, in bhp) of a motor car engine was measured at a chosen set of values of running s...
A: The t - test statistic for the significance of regression slope coefficient is defined below ...
Q: The 65th percentile in a set of data is 80. What does this mean? A At least 35% of the scores are le...
A:
Q: Find and provide the solution of the sample mode, and sample variance of the values 8, 10, 4.
A:
Q: 1. What is the critical value for the following scenario? We want to test if the average production ...
A: Given that Test : The average production of the company is at least 30 units per day. Confidence le...
Q: (c) Is the computation in part (b) rely on the Central Limit Theorem? Explain.
A: In a large farm, the weights of chickens follow a normal distribution
Q: 4. A sample of heights in feet of active volcanoes in North America, outside of Alaska, is listed be...
A: From the provided information, Sample size (n) = 6 Level of significance (α) = 0.05
Q: Suppose thatX is a Poisson random variable with i = 6. Round your answers to 3 decimal places (e.g. ...
A: X~Pois(λ=6) This Probability value calculated from standard normal distribution for approximate pro...
Q: Occasionally an airline will lose a baq. Suppose a small airline has found it can reasonably model t...
A: “Since you have asked multiple questions, we will solve the first question for you. If you want any ...
Q: Suppose that the length X of the life (in years) of a battery for a computer has a distribution that...
A:
Q: A particular fruit's weights are normally distributed, with a mean of 678 grams and a standard devia...
A: Let X denote the fruit's weights. Given that X follows N(mean = 678, SD = 8), then Z = (X - mean)/SD...
Q: eviclara rs has declined in 1%, and the use of 7% to 20.4%. A ity indicated that 54 urvey. At the a ...
A:
Q: Given that the mean weight of senior high school students is 65kg with a standard deviation of 10kg....
A: given that ; let random variable X be a weight of senior high school students.and mean(μ)=65 kg sta...
Q: The Z-values in Questions 5 and 6 should be expressed to the hundredths place (two decimal places). ...
A: Required probability is P(Z>z0)=0.9901

Step by step
Solved in 2 steps with 2 images

- Read measurements a-h on the enlarged 32nds and 64th graduated fractional rule shown in Figure 38-3.The over-cumulative series plot of a classified frequency series is given below. What is the median value of the classified series?To seethe effect of a relatively small error in the estimate of the amountof carbon-14 in a sample being dated, consider this hypotheticalsituation: A bone fragment found in central Illinois in the year 2000 contains 17% of its original carbon-14 content. Estimate the year the animal died.
- For this question, create a new column in the dataset where total rainfall is just the sum of our three separate rainfall variables. (Solve this question by Excel)(a) plot crop yield vs. time. Does yield appear to be stationary? Why or why not? (b) plot total rainfall vs. time. Does total rainfall appear to be stationary? Why or why not? (c) plot the first-difference of crop yield vs. time. Does this series appear to be stationary? Why or why not? (d) formally test whether crop yield, rainfall and the first-difference of crop yield are stationary using the appropriate test. Be sure to do all parts of the hypothesis tests. After these tests, what can you say the order of integration is for each of the variables?(e) estimate a model where yield is a function of rainfall and time. You do not have to worry about the time variable being stationary or not, but the other two must be stationary (you might need to difference one or both of them to make it stationary). Fully report your…For the exponential distribution with parameter 3, what is P(1≤X≤2)?Suppose the following are the seasonal indices for the first three quarters of the year for a quarterly series: Quarter Seasonal Index Q1 73.7 Q2 82.5 Q3 108.1 Remember that the seasonal indices should average 100 so you should be able to infer the seasonal index for Q4. Furthermore, suppose that the estimated coeffcients from a regression of the deseasonalized series on Time are given below: Coefficients Intercept 2,733 Time 65.8 If the original value of the series in a Q4 was 2,197, then what is the seasonally adjusted value?
- Using a weight of 1/2 for the most recent observation, 1/3 for the second most recent, and 1/6 for third most recent, compute a three-week weighted moving average for the time series. Use rounded for two decimal places values for intermediate calculations. Use minus sign for negative values.For this question, create a new column in the dataset where total rainfall is just the sum of our three separate rainfall variables. (Solve this question by Excel and Autocorrelation knowlege) (a) plot crop yield vs. time. Does yield appear to be stationary? Why or why not? (b) plot total rainfall vs. time. Does total rainfall appear to be stationary? Why or why not? (c) plot the first-difference of crop yield vs. time. Does this series appear to be stationary? Why or why not? (d) formally test whether crop yield, rainfall and the first-difference of crop yield are stationary using the appropriate test. Be sure to do all parts of the hypothesis tests. After these tests, what can you say the order of integration is for each of the variables?(e) estimate a model where yield is a function of rainfall and time. You do not have to worry about the time variable being stationary or not, but the other two must be stationary (you might need to difference one or both of them to make it…A company pays its employees an average wage of $22.50 an hour with a standarddeviation of $2.30. If the wages are approximately normally distributed and paid to thenearest centavos, what percentage of the workers receive wages between $20 and $23.50?
- Which of the following is a valid cumulative distribution function? Note: the arrow means the line extends to +inf.The diameter of a metal shaft used in a disk-drive unit is normally distributed with mean 0.2508 in. and std. dev. 0.0005 in. The specification on the shaft have been established as (0.25-0.0015 in, 0.25+0.0015in) If the process mean has been adjusted to 0.25 in, what fraction of the shafts produced does NOT conform to specifications? a). 0.0027 b). 0.0013 c).0.08 d). 0.16Here sample 10 people in a high school to try to predict GPA in 10th grade from GPA in 9th grade. here determine that SSE = 5.8. Compute the standard error of the estimate?
