CORN MARKET $15 - Supply $1 $9 Demand 40 60 75 QUANTITY OF CORN (units per year) 2. The graph above shows the perfectly competitive corn market. (a) Between the prices of $9 and $11, is the demand for corn relatively elastic, perfectly elastic, unit elastic, relatively inelastic, or perfectly inelastic? Explain using specific values. Suppose the government is considering different programs to help corn farmers in the market represented above. (b) Program 1: The government establishes a price floor at $11. How much corn will be purchased by consumers? (c) Program 2: The government guarantees a market price of $11 by purchasing all the surplus corn. How much corn will the govemment need to purchase? (d) Program 3: The government pays farmers to switch to wheat production. Redraw the graph of the corn market above including the numbers, and show the shift that illustrates how paying farmers to switch to wheat production can achieve a market price of $11 for corn. (e) Program 4: The government successfully markets corn as an export. (i) Explain how increasing exports can achieve a market price of $11. (ii) Calculate the producer surplus when the government successfully raises the price of corn to $11 by marketing it as an export. Show your work. PRICE ($ per unit)
CORN MARKET $15 - Supply $1 $9 Demand 40 60 75 QUANTITY OF CORN (units per year) 2. The graph above shows the perfectly competitive corn market. (a) Between the prices of $9 and $11, is the demand for corn relatively elastic, perfectly elastic, unit elastic, relatively inelastic, or perfectly inelastic? Explain using specific values. Suppose the government is considering different programs to help corn farmers in the market represented above. (b) Program 1: The government establishes a price floor at $11. How much corn will be purchased by consumers? (c) Program 2: The government guarantees a market price of $11 by purchasing all the surplus corn. How much corn will the govemment need to purchase? (d) Program 3: The government pays farmers to switch to wheat production. Redraw the graph of the corn market above including the numbers, and show the shift that illustrates how paying farmers to switch to wheat production can achieve a market price of $11 for corn. (e) Program 4: The government successfully markets corn as an export. (i) Explain how increasing exports can achieve a market price of $11. (ii) Calculate the producer surplus when the government successfully raises the price of corn to $11 by marketing it as an export. Show your work. PRICE ($ per unit)

Chapter6: Elasticities
Section: Chapter Questions
Problem 12P

Related questions

Question
I'd like help on all the questions
Transcribed Image Text:CORN MARKET
$15
Supply
$11
$9
Demand
40 60 75 QUANTITY OF CORN
(units per year)
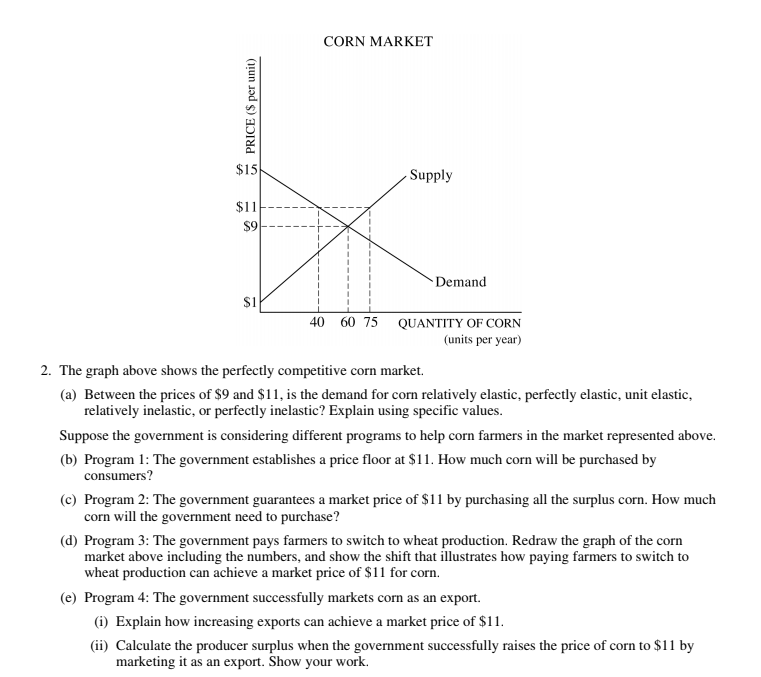
2. The graph above shows the perfectly competitive corn market.
(a) Between the prices of $9 and $11, is the demand for corn relatively elastic, perfectly elastic, unit elastic,
relatively inelastic, or perfectly inelastic? Explain using specific values.
Suppose the government is considering different programs to help corn farmers in the market represented above.
(b) Program 1: The government establishes a price floor at $11. How much corn will be purchased by
consumers?
(c) Program 2: The government guarantees a market price of $11 by purchasing all the surplus corn. How much
corn will the government need to purchase?
(d) Program 3: The government pays farmers to switch to wheat production. Redraw the graph of the corn
market above including the numbers, and show the shift that illustrates how paying farmers to switch to
wheat production can achieve a market price of $11 for corn.
(e) Program 4: The government successfully markets corn as an export.
(i) Explain how increasing exports can achieve a market price of $11.
(ii) Calculate the producer surplus when the government successfully raises the price of corn to $11 by
marketing it as an export. Show your work.
PRICE ($ per unit)
Expert Solution
This question has been solved!
Explore an expertly crafted, step-by-step solution for a thorough understanding of key concepts.

This is a popular solution!

Trending now
This is a popular solution!

Step by step
Solved in 3 steps

Knowledge Booster


Learn more about
Need a deep-dive on the concept behind this application? Look no further. Learn more about this topic, economics and related others by exploring similar questions and additional content below.Recommended textbooks for you
Exploring Economics
Economics
ISBN:
9781544336329
Author:
Robert L. Sexton
Publisher:
SAGE Publications, Inc


Economics (MindTap Course List)
Economics
ISBN:
9781337617383
Author:
Roger A. Arnold
Publisher:
Cengage Learning
Exploring Economics
Economics
ISBN:
9781544336329
Author:
Robert L. Sexton
Publisher:
SAGE Publications, Inc
Economics (MindTap Course List)
Economics
ISBN:
9781337617383
Author:
Roger A. Arnold
Publisher:
Cengage Learning


