Could it be that smoking actually increases survival rates among women? The accompanying data represent the 20-year survival status and smoking status of 1334 women who participated in a 20-year cohort study. Complete parts (a) through (e).
Could it be that smoking actually increases survival rates among women? The accompanying data represent the 20-year survival status and smoking status of 1334 women who participated in a 20-year cohort study. Complete parts (a) through (e).

Linear Algebra: A Modern Introduction
4th Edition
ISBN:9781285463247
Author:David Poole
Publisher:David Poole
Chapter3: Matrices
Section3.7: Applications
Problem 44EQ

Related questions
Question
Could it be that smoking actually increases survival rates among women? The accompanying data represent the 20-year survival status and smoking status of
1334 women who participated in a 20-year cohort study. Complete parts (a) through (e).
Transcribed Image Text:0.95 of 1
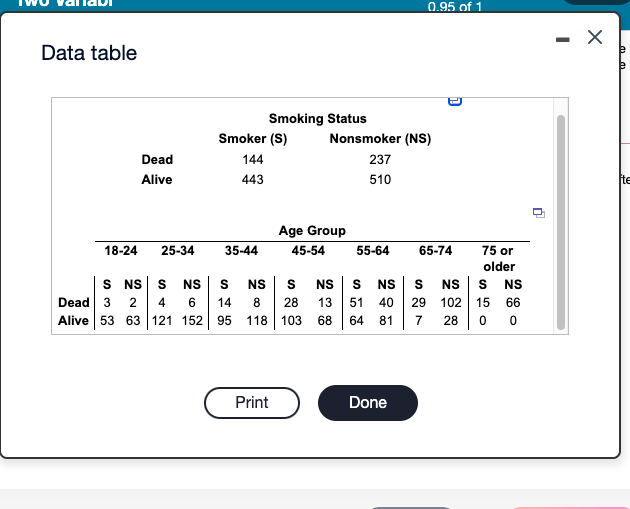
Data table
Smoking Status
Smoker (S)
Nonsmoker (NS)
Dead
144
237
Alive
443
510
te
Age Group
18-24
25-34
35-44
45-54
55-64
65-74
75 or
older
S NS| S
Dead 3 2
Alive 53 63 121 152 95 118 103 68
S NS
29 102 15 66
0 0
NS
NS
NS
NS
NS
4
6
14
8
28
13 51 40
64
81
7
28
Print
Done
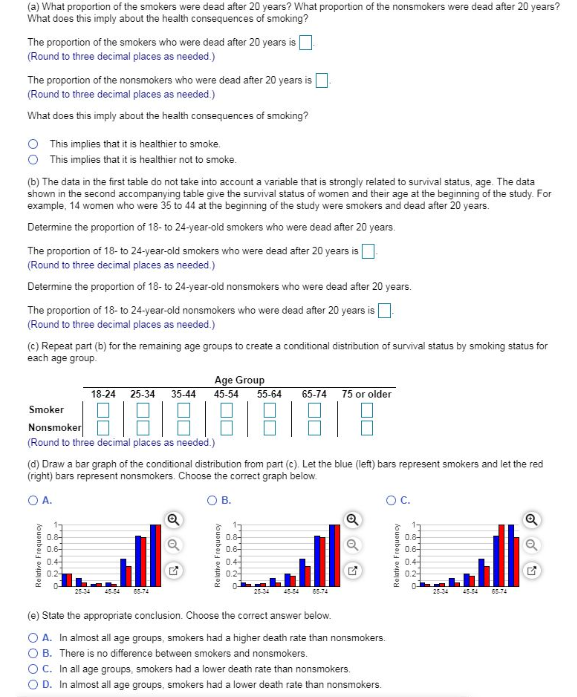
Transcribed Image Text:(a) What proportion of the smokers were dead after 20 years? What proportion of the nonsmokers were dead after 20 years?
What does this imply about the health consequences of smoking?
The proportion of the smokers who were dead after 20 years is
(Round to three decimal places as needed)
The proportion of the nonsmokers who were dead after 20 years is
(Round to three decimal places as needed)
What does this imply about the health consequences of smoking?
O This implies that it is healthier to smoke.
This implies that it is healthier not to smoke.
(b) The data in the first table do not take into account a variable that is strongly related to survival status, age. The data
shown in the second accompanying table give the survival status of women and their age at the beginning of the study. For
example, 14 women who were 35 to 44 at the beginning of the study were smokers and dead after 20 years.
Determine the proportion of 18- to 24-year-old smokers who were dead after 20 years.
The proportion of 18- to 24-year-old smokers who were dead after 20 years isD
(Round to three decimal places as needed)
Determine the proportion of 18- to 24-year-old nonsmokers who were dead after 20 years.
The proportion of 18- to 24-year-old nonsmokers who were dead after 20 years is O
(Round to three decimal places as needed.)
(c) Repeat part (b) for the remaining age groups to create a conditional distribution of survival status by smoking status for
each age group.
Age Group
55-64
18-24 25-34
35-44
45-54
65-74
75 or older
Smoker
Nonsmoker
(Round to three decimal places as needed.)
(d) Draw a bar graph of the conditional distribution from part (c). Let the blue (left) bars represent smokers and let the red
(right) bars represent nonsmokers. Choose the correct graph below.
O A.
В.
OC.
0.8-
0.6-
1
0.8-
0.6-
17
0.6-
0.6
0.4
0.2
0.4-
0.4-
02-
0.2
25-34
454
05-74
454
65-74
45-4
65-74
(e) State the appropriate conclusion. Choose the correct answer below.
O A. In almost all age groups, smokers had a higher death rate than nonsmokers.
O B. There is no difference between smokers and nonsmokers.
O C. In all age groups, smokers had a lower death rate than nonsmokers.
OD. In almost all age groups, smokers had a lower death rate than nonsmokers.
Relative Frequency
Expert Solution
Step 1
The accompanying data represent the 20-year survival status and smoking status of
1334 women who participated in a 20-year cohort study.

Trending now
This is a popular solution!

Step by step
Solved in 2 steps with 1 images

Recommended textbooks for you
Linear Algebra: A Modern Introduction
Algebra
ISBN:
9781285463247
Author:
David Poole
Publisher:
Cengage Learning

Elementary Algebra
Algebra
ISBN:
9780998625713
Author:
Lynn Marecek, MaryAnne Anthony-Smith
Publisher:
OpenStax - Rice University

Algebra & Trigonometry with Analytic Geometry
Algebra
ISBN:
9781133382119
Author:
Swokowski
Publisher:
Cengage
Linear Algebra: A Modern Introduction
Algebra
ISBN:
9781285463247
Author:
David Poole
Publisher:
Cengage Learning
Elementary Algebra
Algebra
ISBN:
9780998625713
Author:
Lynn Marecek, MaryAnne Anthony-Smith
Publisher:
OpenStax - Rice University
Algebra & Trigonometry with Analytic Geometry
Algebra
ISBN:
9781133382119
Author:
Swokowski
Publisher:
Cengage

Functions and Change: A Modeling Approach to Coll…
Algebra
ISBN:
9781337111348
Author:
Bruce Crauder, Benny Evans, Alan Noell
Publisher:
Cengage Learning

Intermediate Algebra
Algebra
ISBN:
9781285195728
Author:
Jerome E. Kaufmann, Karen L. Schwitters
Publisher:
Cengage Learning