course. At the 5% significance level determine if the average grade of students in a support course is higher than those that do not enroll in support course. Give the hypotheses.
course. At the 5% significance level determine if the average grade of students in a support course is higher than those that do not enroll in support course. Give the hypotheses.

Glencoe Algebra 1, Student Edition, 9780079039897, 0079039898, 2018
18th Edition
ISBN:9780079039897
Author:Carter
Publisher:Carter
Chapter10: Statistics
Section10.4: Distributions Of Data
Problem 19PFA

Related questions
Question
Question 1: Give the hypotheses.
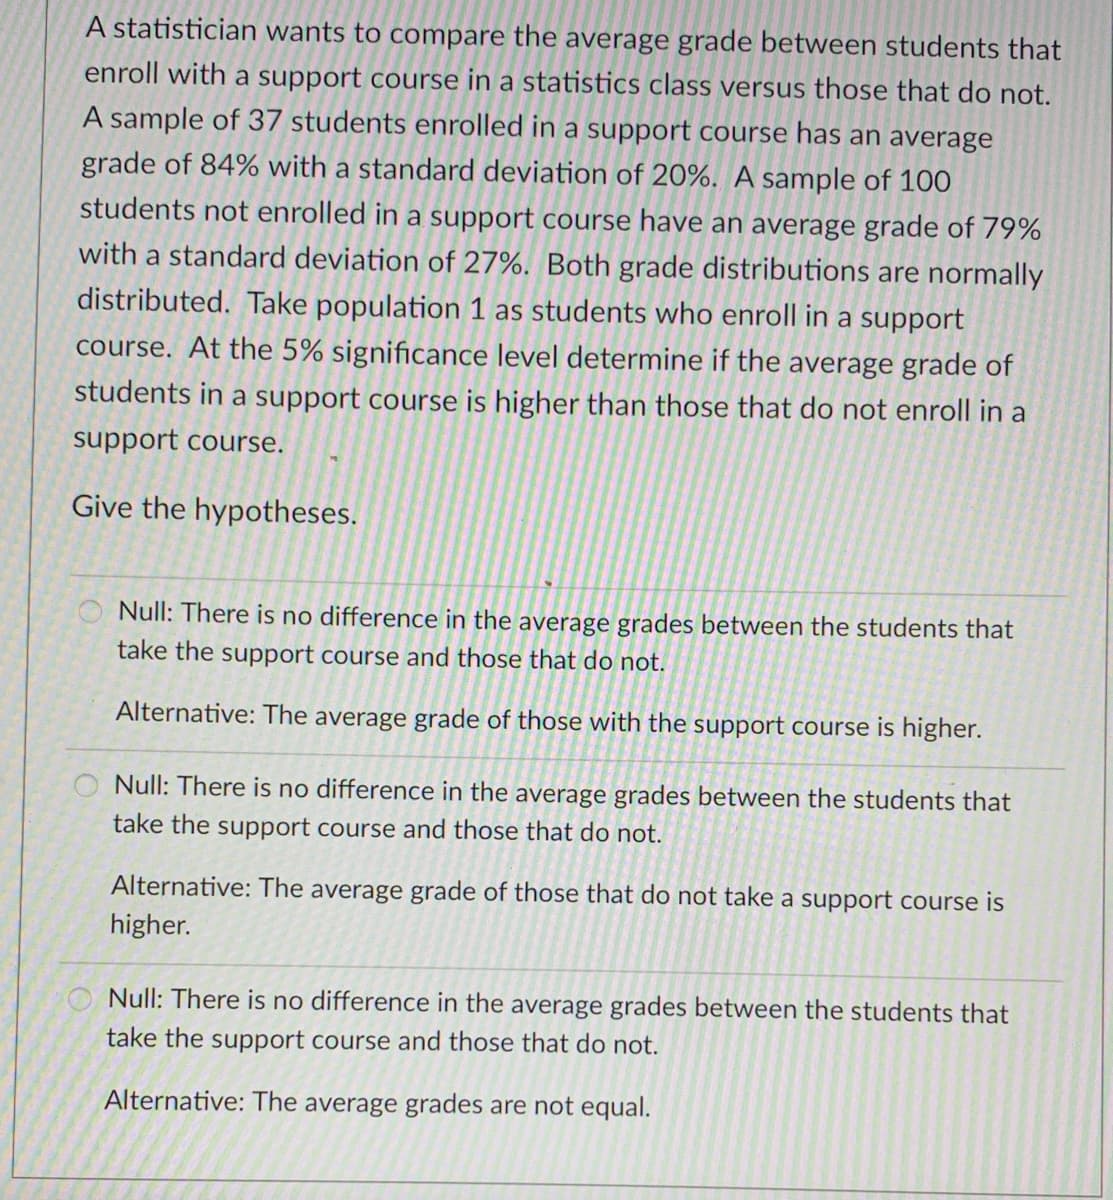
Transcribed Image Text:A statistician wants to compare the average grade between students that
enroll with a support course in a statistics class versus those that do not.
A sample of 37 students enrolled in a support course has an average
grade of 84% with a standard deviation of 20%. A sample of 100
students not enrolled in a support course have an average grade of 79%
with a standard deviation of 27%. Both grade distributions are normally
distributed. Take population 1 as students who enroll in a support
course. At the 5% significance level determine if the average grade of
students in a support course is higher than those that do not enroll in a
support course.
Give the hypotheses.
Null: There is no difference in the average grades between the students that
take the support course and those that do not.
Alternative: The average grade of those with the support course is higher.
O Null: There is no difference in the average grades between the students that
take the support course and those that do not.
Alternative: The average grade of those that do not take a support course is
higher.
Null: There is no difference in the average grades between the students that
take the support course and those that do not.
Alternative: The average grades are not equal.
Expert Solution
This question has been solved!
Explore an expertly crafted, step-by-step solution for a thorough understanding of key concepts.

This is a popular solution!

Trending now
This is a popular solution!

Step by step
Solved in 2 steps

Recommended textbooks for you
Glencoe Algebra 1, Student Edition, 9780079039897…
Algebra
ISBN:
9780079039897
Author:
Carter
Publisher:
McGraw Hill
Glencoe Algebra 1, Student Edition, 9780079039897…
Algebra
ISBN:
9780079039897
Author:
Carter
Publisher:
McGraw Hill