1. Construct a 90% confidence interval for the proportion of employees requiring size 3.
1. Construct a 90% confidence interval for the proportion of employees requiring size 3.

College Algebra (MindTap Course List)
12th Edition
ISBN:9781305652231
Author:R. David Gustafson, Jeff Hughes
Publisher:R. David Gustafson, Jeff Hughes
Chapter8: Sequences, Series, And Probability
Section8.7: Probability
Problem 58E: What is meant by the sample space of an experiment?

Related questions
Question
Question number (2)
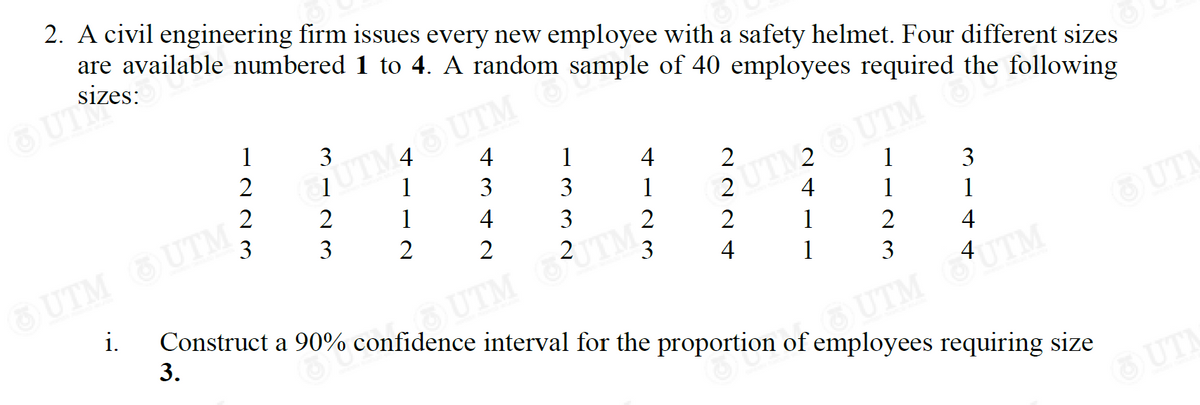
Transcribed Image Text:2. A civil engineering firm issues every new employee with a safety helmet. Four different sizes
are available numbered
1 to 4. A random sample of 40 employees required the following
4
1
Į UTM46) UTM
4
1
2
3
3
1
1
3
1
2UTM2 UTM the
4
4
3
1
2
1
2
2
2
1
2
3
4
1
OUTM UTM :
3
i. Construct a 90% confidence interval for the proportion of employees requiring size
3.
UTM JTM?
3 UTM UTM
O
1223
3123
3 3
+4
UTM
Expert Solution
This question has been solved!
Explore an expertly crafted, step-by-step solution for a thorough understanding of key concepts.

Step by step
Solved in 2 steps

Recommended textbooks for you
College Algebra (MindTap Course List)
Algebra
ISBN:
9781305652231
Author:
R. David Gustafson, Jeff Hughes
Publisher:
Cengage Learning
College Algebra (MindTap Course List)
Algebra
ISBN:
9781305652231
Author:
R. David Gustafson, Jeff Hughes
Publisher:
Cengage Learning