Create a graph for the aggregate expenditures (AE) model in Excel using the data from Table 1: A Private Closed Economy. (table 1 is in the attachment)   tips: Remember, the 45degree line (also known as the Keynesian Cross) is a tool that shows how differences in aggregate expenditures and real GDP can affect business inventories which will affect future levels of real GDP.  Aggregate expenditure and GDP are both function of consumption, investment, government spending, and net exports.    So, the equations for the two are identical:  Y = C + I + G + NX, and AE (aggregate expenditure) = C + I + G + NX   For private closed economy the equation is:  Y = C + I , and AE (aggregate expenditure) = C + I

ENGR.ECONOMIC ANALYSIS
14th Edition
ISBN:9780190931919
Author:NEWNAN
Publisher:NEWNAN
Chapter1: Making Economics Decisions
Section: Chapter Questions
Problem 1QTC
icon
Related questions
Question

This question has four parts, here is the fourth and final part. 

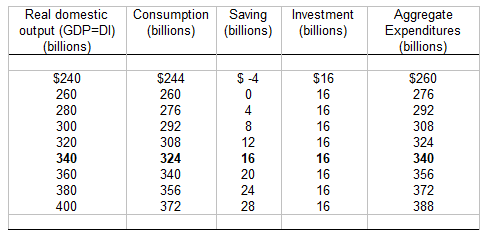
1.4. Create a graph for the aggregate expenditures (AE) model in Excel using the data from Table 1: A Private Closed Economy. (table 1 is in the attachment)


tips:

Remember, the 45degree line (also known as the Keynesian Cross) is a tool that shows how differences in aggregate expenditures and real GDP can affect business inventories which will affect future levels of real GDP.  Aggregate expenditure and GDP are both function of consumption, investment, government spending, and net exports.   

So, the equations for the two are identical: 

Y = C + I + G + NX, and AE (aggregate expenditure) = C + I + G + NX  

For private closed economy the equation is: 

Y = C + I , and AE (aggregate expenditure) = C + I   

Real domestic
Consumption Saving Investment
output (GDP=DI) (billions) (billions) (billions)
(billions)
$240
260
280
300
320
340
360
380
400
$244
260
276
292
308
324
340
356
372
$-4
4
8
262220
12
16
24
28
$16
16
16
16
16
16
16
16
16
Aggregate
Expenditures
(billions)
$260
276
292
308
324
340
356
372
388
Transcribed Image Text:Real domestic Consumption Saving Investment output (GDP=DI) (billions) (billions) (billions) (billions) $240 260 280 300 320 340 360 380 400 $244 260 276 292 308 324 340 356 372 $-4 4 8 262220 12 16 24 28 $16 16 16 16 16 16 16 16 16 Aggregate Expenditures (billions) $260 276 292 308 324 340 356 372 388
Expert Solution
steps

Step by step

Solved in 2 steps with 1 images

Blurred answer
Knowledge Booster
Aggregate Expenditure Schedule
Learn more about
Need a deep-dive on the concept behind this application? Look no further. Learn more about this topic, economics and related others by exploring similar questions and additional content below.
Similar questions
  • SEE MORE QUESTIONS
Recommended textbooks for you
ENGR.ECONOMIC ANALYSIS
Economics
ISBN:
9780190931919
Author:
NEWNAN
Publisher:
Oxford University Press
Principles of Economics (12th Edition)
Economics
ISBN:
9780134078779
Author:
Karl E. Case, Ray C. Fair, Sharon E. Oster
Publisher:
PEARSON
Engineering Economy (17th Edition)
Economics
ISBN:
9780134870069
Author:
William G. Sullivan, Elin M. Wicks, C. Patrick Koelling
Publisher:
PEARSON
Principles of Economics (MindTap Course List)
Economics
ISBN:
9781305585126
Author:
N. Gregory Mankiw
Publisher:
Cengage Learning
Managerial Economics: A Problem Solving Approach
Economics
ISBN:
9781337106665
Author:
Luke M. Froeb, Brian T. McCann, Michael R. Ward, Mike Shor
Publisher:
Cengage Learning
Managerial Economics & Business Strategy (Mcgraw-…
Economics
ISBN:
9781259290619
Author:
Michael Baye, Jeff Prince
Publisher:
McGraw-Hill Education