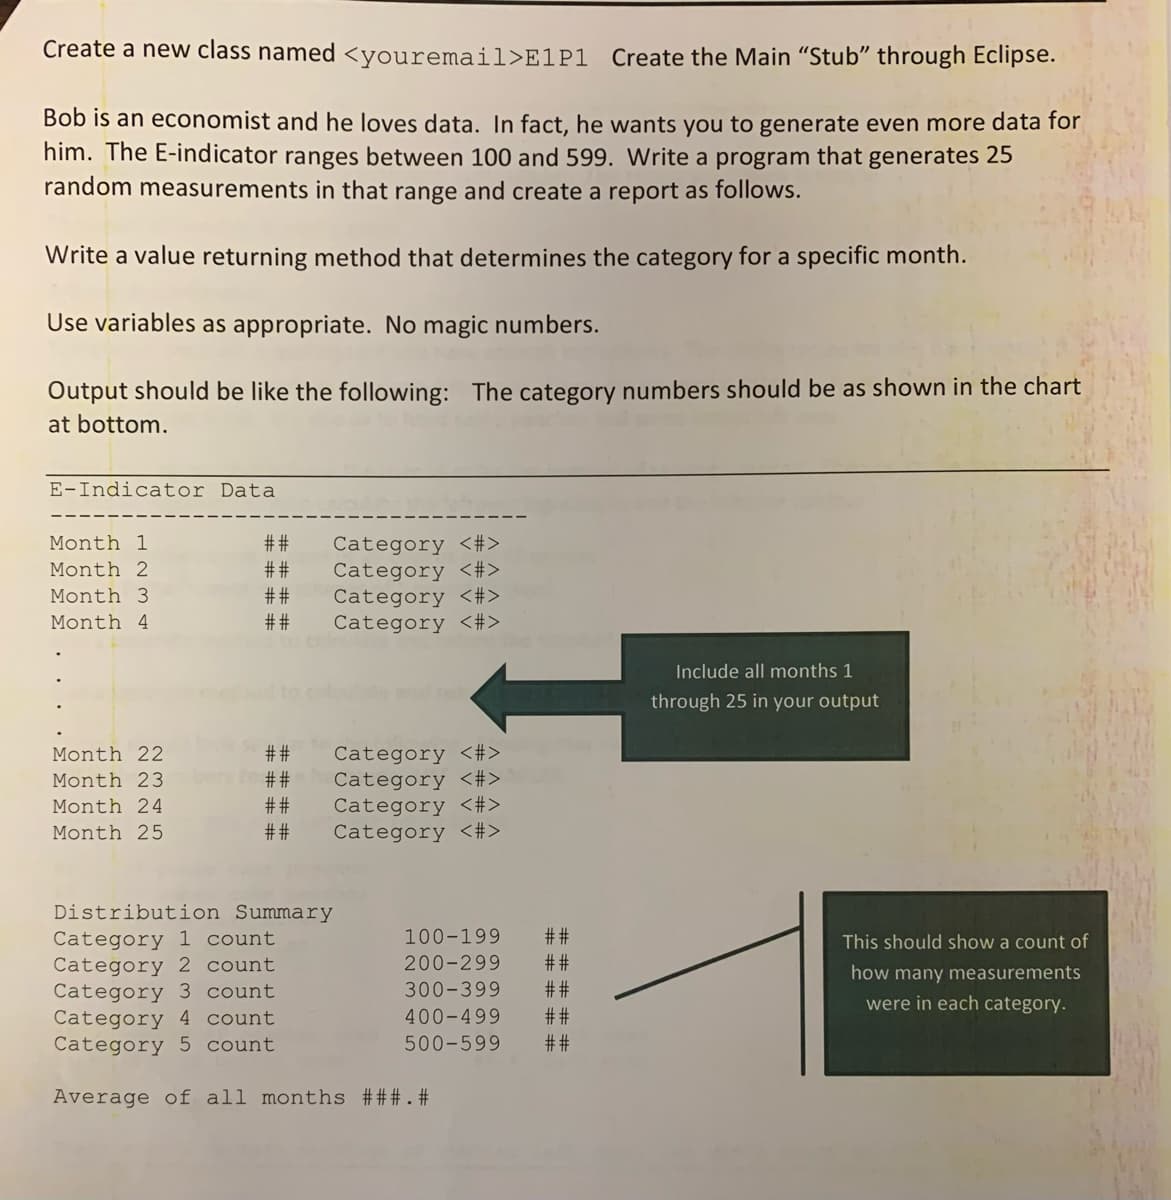
Create a new class named E1P1 Create the Main “Stub" through Eclipse. Bob is an economist and he loves data. In fact, he wants you to generate even more data for him. The E-indicator ranges between 100 and 599. Write a program that generates 25 random measurements in that range and create a report as follows. Write a value returning method that determines the category for a specific month. Use variables as appropriate. No magic numbers. Output should be like the following: The category numbers should be as shown in the chart at bottom. E-Indicator Data Category <#> Category <#> Category <#> Category <#> Month 1 ## Month 2 ## Month 3 ## Month 4 ## Include all months 1 through 25 in your output Category <#> Category <#> Month 22 ## Month 23 ## ## Category <#> Category <#> Month 24 Month 25 ## Distribution Summary #%# Category 1 count Category 2 count Category 3 count Category 4 count Category 5 count 100-199 This should show a count of 200-299 ## how many measurements #%# ## ## 300-399 were in each category. 400-499 500-599 Average of all months ###.#

EBK JAVA PROGRAMMING
9th Edition
ISBN:9781337671385
Author:FARRELL
Publisher:FARRELL
Chapter1: Creating Java Programs
Section: Chapter Questions
Problem 12PE
icon
Related questions
Question
Please help me with this Java Lab
Create a new class named <youremail>E1P1 Create the Main "“Stub" through Eclipse.
Bob is an economist and he loves data. In fact, he wants you to generate even more data for
him. The E-indicator ranges between 100 and 599. Write a program that generates 25
random measurements in that range and create a report as follows.
Write a value returning method that determines the category for a specific month.
Use variables as appropriate. No magic numbers.
Output should be like the following: The category numbers should be as shown in the chart
at bottom.
E-Indicator Data
##
Category <#>
Category <#>
Month 1
Month 2
##
Category <#>
Category <#>
Month 3
##
Month 4
##
Include all months 1
through 25 in your output
Category <#>
Category <#>
Category <#>
Category <#>
Month 22
##
Month 23
##
##
Month 24
Month 25
##
Distribution Summary
Category 1 count
Category 2 count
Category 3 count
Category 4 count
Category 5 count
100-199
#%#
This should show a count of
200-299
##
how many measurements
##
##
##
300-399
were in each category.
400-499
500-599
Average of all months ###.#
Transcribed Image Text:Create a new class named <youremail>E1P1 Create the Main "“Stub" through Eclipse. Bob is an economist and he loves data. In fact, he wants you to generate even more data for him. The E-indicator ranges between 100 and 599. Write a program that generates 25 random measurements in that range and create a report as follows. Write a value returning method that determines the category for a specific month. Use variables as appropriate. No magic numbers. Output should be like the following: The category numbers should be as shown in the chart at bottom. E-Indicator Data ## Category <#> Category <#> Month 1 Month 2 ## Category <#> Category <#> Month 3 ## Month 4 ## Include all months 1 through 25 in your output Category <#> Category <#> Category <#> Category <#> Month 22 ## Month 23 ## ## Month 24 Month 25 ## Distribution Summary Category 1 count Category 2 count Category 3 count Category 4 count Category 5 count 100-199 #%# This should show a count of 200-299 ## how many measurements ## ## ## 300-399 were in each category. 400-499 500-599 Average of all months ###.#
Expert Solution
Algorithm

Step 1 : Start

Step 2 : Create a method getCategory() which accepts a number and returns it's respective category it belongs to to the main calling method.

Step 3 : In the main method create a for loop and generate 25 random numbers using the random class and storing the in an array of integers.

Step 4 : Add the numbers together for further average calculation.

Step 5 : Incrementing the Category Counter Array according to the number generated using an if else if statement.

Step 6 : Compute the average of all the numbers generated.

Step 7 : Using a for loop print the Month Number ,  E-Indicator Numbers and the category it belongs to by calling the getCategory() method and passing the number.

Step 8 : Print the category distribution by printing the Category Number and the Count of the Numbers in each category.

Step 9 : Print the average of all the randomly generated numbers.

Step 10 : Stop

trending now

Trending now

This is a popular solution!

steps

Step by step

Solved in 4 steps with 8 images

Blurred answer
Knowledge Booster
Random Class and its operations
Learn more about
Need a deep-dive on the concept behind this application? Look no further. Learn more about this topic, computer-science and related others by exploring similar questions and additional content below.
Similar questions
  • SEE MORE QUESTIONS
Recommended textbooks for you
EBK JAVA PROGRAMMING
Computer Science
ISBN:
9781337671385
Author:
FARRELL
Publisher:
CENGAGE LEARNING - CONSIGNMENT