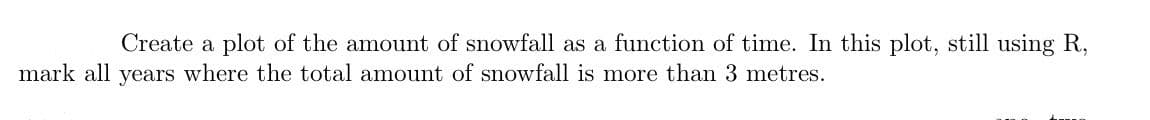
Create a plot of the amount of snowfall as a function of time. In this plot, still using R, mark all years where the total amount of snowfall is more than 3 metres.
Create a plot of the amount of snowfall as a function of time. In this plot, still using R, mark all years where the total amount of snowfall is more than 3 metres.

College Algebra (MindTap Course List)
12th Edition
ISBN:9781305652231
Author:R. David Gustafson, Jeff Hughes
Publisher:R. David Gustafson, Jeff Hughes
Chapter8: Sequences, Series, And Probability
Section8.CR: Chapter Review
Problem 37E: Find the positive geometric mean between 4 and 64.

Related questions
Question
No need to give me an accurate answer, just give me needed code in R is ok, please(the set data has 109 rows and 2 column,and picture show the example of them)
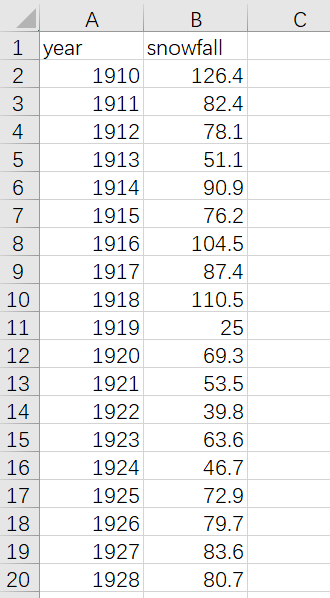
Transcribed Image Text:1 year
2
AWN
3
4
L 6
5
A
7
8
9
10
11
12
13
14
15
16
17
18
19
20
1910
1911
1912
1913
1914
1915
1916
1917
1918
1919
1920
1921
1922
1923
1924
1925
1926
1927
1928
B
snowfall
126.4
82.4
78.1
51.1
90.9
76.2
104.5
87.4
110.5
25
69.3
53.5
39.8
63.6
46.7
72.9
79.7
83.6
80.7
C
Transcribed Image Text:Create a plot of the amount of snowfall as a function of time. In this plot, still using R,
mark all years where the total amount of snowfall is more than 3 metres.
Expert Solution
This question has been solved!
Explore an expertly crafted, step-by-step solution for a thorough understanding of key concepts.

Step by step
Solved in 3 steps

Recommended textbooks for you
College Algebra (MindTap Course List)
Algebra
ISBN:
9781305652231
Author:
R. David Gustafson, Jeff Hughes
Publisher:
Cengage Learning

Algebra & Trigonometry with Analytic Geometry
Algebra
ISBN:
9781133382119
Author:
Swokowski
Publisher:
Cengage
College Algebra (MindTap Course List)
Algebra
ISBN:
9781305652231
Author:
R. David Gustafson, Jeff Hughes
Publisher:
Cengage Learning
Algebra & Trigonometry with Analytic Geometry
Algebra
ISBN:
9781133382119
Author:
Swokowski
Publisher:
Cengage