Cross out salaries for Company F and Company G. What is mean and median for the set of Companies A through E?
Cross out salaries for Company F and Company G. What is mean and median for the set of Companies A through E?

MATLAB: An Introduction with Applications
6th Edition
ISBN:9781119256830
Author:Amos Gilat
Publisher:Amos Gilat
Chapter1: Starting With Matlab
Section: Chapter Questions
Problem 1P

Related questions
Question
Refer to Table 7-3. Cross out salaries for Company F and Company G. What is mean and median for the set of Companies A through E?
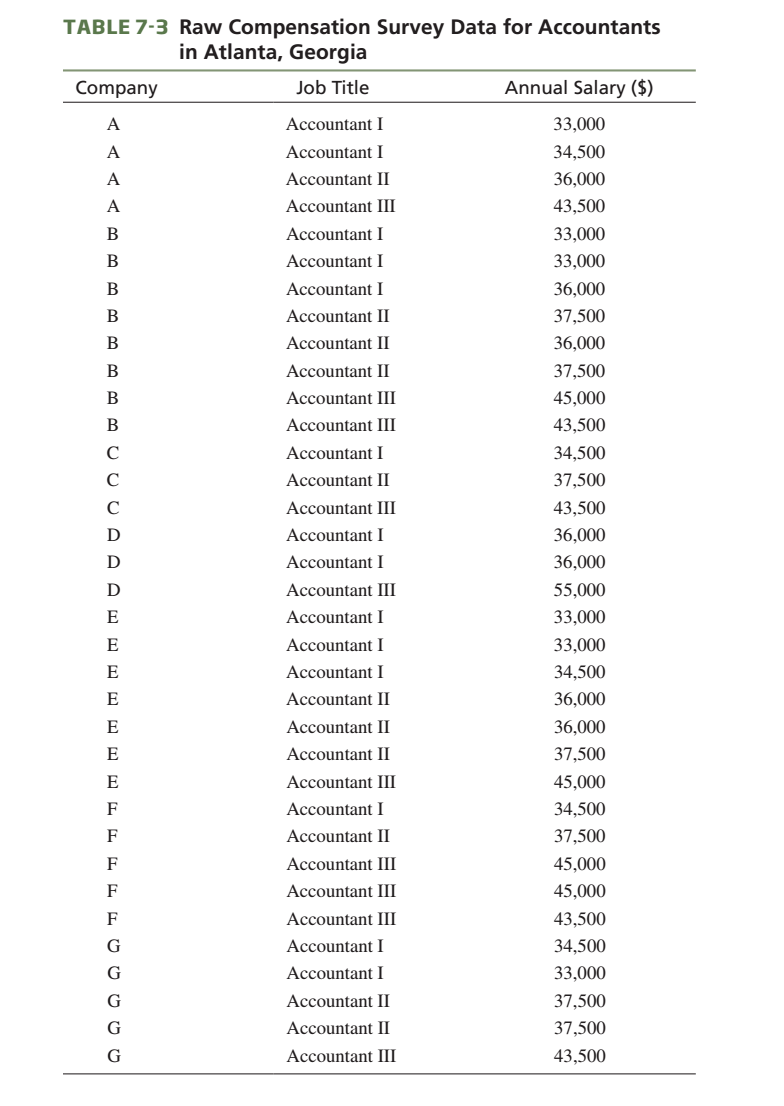
Transcribed Image Text:TABLE 7-3 Raw Compensation Survey Data for Accountants
in Atlanta, Georgia
Company
Job Title
Annual Salary ($)
A
Accountant I
33,000
A
Accountant I
34,500
A
Accountant II
36,000
A
Accountant III
43,500
В
Accountant I
33,000
B
Accountant I
33,000
Accountant I
36,000
В
Accountant II
37,500
В
Accountant I
36,000
B
Accountant II
37,500
В
Accountant III
45,000
В
Accountant III
43,500
C
Accountant I
34,500
C
Accountant II
37,500
C
Accountant III
43,500
D
Accountant I
36,000
D
Accountant I
36,000
D
Accountant III
55,000
E
Accountant I
33,000
E
Accountant I
33,000
E
Accountant I
34,500
E
Accountant II
36,000
E
Accountant II
36,000
E
Accountant II
37,500
E
Accountant III
45,000
F
Accountant I
34,500
F
Accountant II
37,500
F
Accountant III
45,000
F
Accountant III
45,000
F
Accountant III
43,500
G
Accountant I
34,500
G
Accountant I
33,000
Accountant II
37,500
G
Accountant II
37,500
G
Accountant III
43,500
Expert Solution
Step 1
Given information:
| Salaries | |
| A | 33000 |
| A | 34500 |
| A | 36000 |
| A | 43500 |
| B | 33000 |
| B | 33000 |
| B | 36000 |
| B | 37500 |
| B | 36000 |
| B | 37500 |
| B | 45000 |
| B | 43500 |
| C | 34500 |
| C | 37500 |
| C | 43500 |
| D | 36000 |
| D | 36000 |
| D | 55000 |
| E | 33000 |
| E | 33000 |
| E | 34500 |
| E | 36000 |
| E | 36000 |
| E | 37500 |
| E | 45000 |

Trending now
This is a popular solution!

Step by step
Solved in 2 steps

Recommended textbooks for you
MATLAB: An Introduction with Applications
Statistics
ISBN:
9781119256830
Author:
Amos Gilat
Publisher:
John Wiley & Sons Inc

Probability and Statistics for Engineering and th…
Statistics
ISBN:
9781305251809
Author:
Jay L. Devore
Publisher:
Cengage Learning

Statistics for The Behavioral Sciences (MindTap C…
Statistics
ISBN:
9781305504912
Author:
Frederick J Gravetter, Larry B. Wallnau
Publisher:
Cengage Learning
MATLAB: An Introduction with Applications
Statistics
ISBN:
9781119256830
Author:
Amos Gilat
Publisher:
John Wiley & Sons Inc
Probability and Statistics for Engineering and th…
Statistics
ISBN:
9781305251809
Author:
Jay L. Devore
Publisher:
Cengage Learning
Statistics for The Behavioral Sciences (MindTap C…
Statistics
ISBN:
9781305504912
Author:
Frederick J Gravetter, Larry B. Wallnau
Publisher:
Cengage Learning

Elementary Statistics: Picturing the World (7th E…
Statistics
ISBN:
9780134683416
Author:
Ron Larson, Betsy Farber
Publisher:
PEARSON

The Basic Practice of Statistics
Statistics
ISBN:
9781319042578
Author:
David S. Moore, William I. Notz, Michael A. Fligner
Publisher:
W. H. Freeman

Introduction to the Practice of Statistics
Statistics
ISBN:
9781319013387
Author:
David S. Moore, George P. McCabe, Bruce A. Craig
Publisher:
W. H. Freeman