Crude oil and petroleum products are imported continuously by the United States. The following table and figure show t years (in billions of dollars per year).† Billions of Dollars Year 2014 219.5 2016 192.0 2018 191.0 2020 198.9 2022 214.5 2024 228.4 230 220 нer year
Crude oil and petroleum products are imported continuously by the United States. The following table and figure show t years (in billions of dollars per year).† Billions of Dollars Year 2014 219.5 2016 192.0 2018 191.0 2020 198.9 2022 214.5 2024 228.4 230 220 нer year

Linear Algebra: A Modern Introduction
4th Edition
ISBN:9781285463247
Author:David Poole
Publisher:David Poole
Chapter4: Eigenvalues And Eigenvectors
Section4.6: Applications And The Perron-frobenius Theorem
Problem 25EQ

Related questions
Topic Video
Question
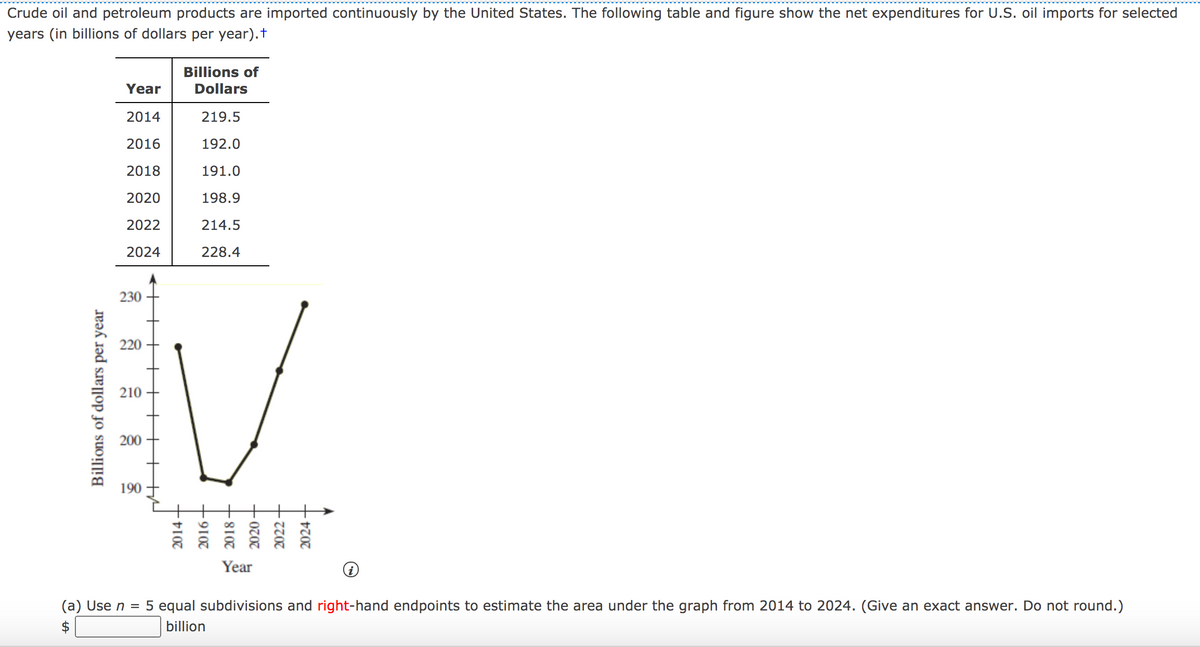
Transcribed Image Text:Crude oil and petroleum products are imported continuously by the United States. The following table and figure show the net expenditures for U.S. oil imports for selected
years (in billions of dollars per year).t
Billions of
Dollars
Year
2014
219.5
2016
192.0
2018
191.0
2020
198.9
2022
214.5
2024
228.4
230
220
210
200
190
Year
(a) Use n =
5 equal subdivisions and right-hand endpoints to estimate the area under the graph from 2014 to 2024. (Give an exact answer. Do not round.)
billion
%24
Billions of dollars per year
2014 -
2016 -
2018 -
+0707
2022 -
2024 +
Expert Solution
This question has been solved!
Explore an expertly crafted, step-by-step solution for a thorough understanding of key concepts.

Step by step
Solved in 2 steps with 1 images

Knowledge Booster


Learn more about
Need a deep-dive on the concept behind this application? Look no further. Learn more about this topic, calculus and related others by exploring similar questions and additional content below.Recommended textbooks for you
Linear Algebra: A Modern Introduction
Algebra
ISBN:
9781285463247
Author:
David Poole
Publisher:
Cengage Learning

Glencoe Algebra 1, Student Edition, 9780079039897…
Algebra
ISBN:
9780079039897
Author:
Carter
Publisher:
McGraw Hill
Linear Algebra: A Modern Introduction
Algebra
ISBN:
9781285463247
Author:
David Poole
Publisher:
Cengage Learning
Glencoe Algebra 1, Student Edition, 9780079039897…
Algebra
ISBN:
9780079039897
Author:
Carter
Publisher:
McGraw Hill