Annual revenue (in million dollars) earned by the CrazyNet are provided below. Year 2001 2002 2003 2004 2005 2006 | 2007 | 2008 | 2009 | 2010 Sales 9. 10 12 18 16 15 16 12 11 10
Annual revenue (in million dollars) earned by the CrazyNet are provided below. Year 2001 2002 2003 2004 2005 2006 | 2007 | 2008 | 2009 | 2010 Sales 9. 10 12 18 16 15 16 12 11 10

Chapter6: Exponential And Logarithmic Functions
Section6.8: Fitting Exponential Models To Data
Problem 1TI: Table 2 shows a recent graduate’s credit card balance each month after graduation. a. Use...

Related questions
Question
7
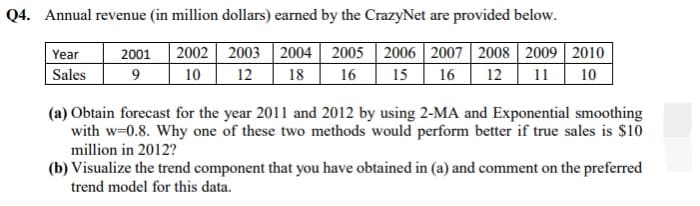
Transcribed Image Text:Q4. Annual revenue (in million dollars) earned by the CrazyNet are provided below.
2001
2002 2003 2004 2005 2006 2007 2008 2009 2010
Year
Sales
9
10
12
18
16
15
16
12
11
10
(a) Obtain forecast for the year 2011 and 2012 by using 2-MA and Exponential smoothing
with w=0.8. Why one of these two methods would perform better if true sales is $10
million in 2012?
(b) Visualize the trend component that you have obtained in (a) and comment on the preferred
trend model for this data.
Expert Solution
This question has been solved!
Explore an expertly crafted, step-by-step solution for a thorough understanding of key concepts.

Step by step
Solved in 2 steps

Recommended textbooks for you

Functions and Change: A Modeling Approach to Coll…
Algebra
ISBN:
9781337111348
Author:
Bruce Crauder, Benny Evans, Alan Noell
Publisher:
Cengage Learning

Linear Algebra: A Modern Introduction
Algebra
ISBN:
9781285463247
Author:
David Poole
Publisher:
Cengage Learning
Functions and Change: A Modeling Approach to Coll…
Algebra
ISBN:
9781337111348
Author:
Bruce Crauder, Benny Evans, Alan Noell
Publisher:
Cengage Learning
Linear Algebra: A Modern Introduction
Algebra
ISBN:
9781285463247
Author:
David Poole
Publisher:
Cengage Learning

Algebra & Trigonometry with Analytic Geometry
Algebra
ISBN:
9781133382119
Author:
Swokowski
Publisher:
Cengage