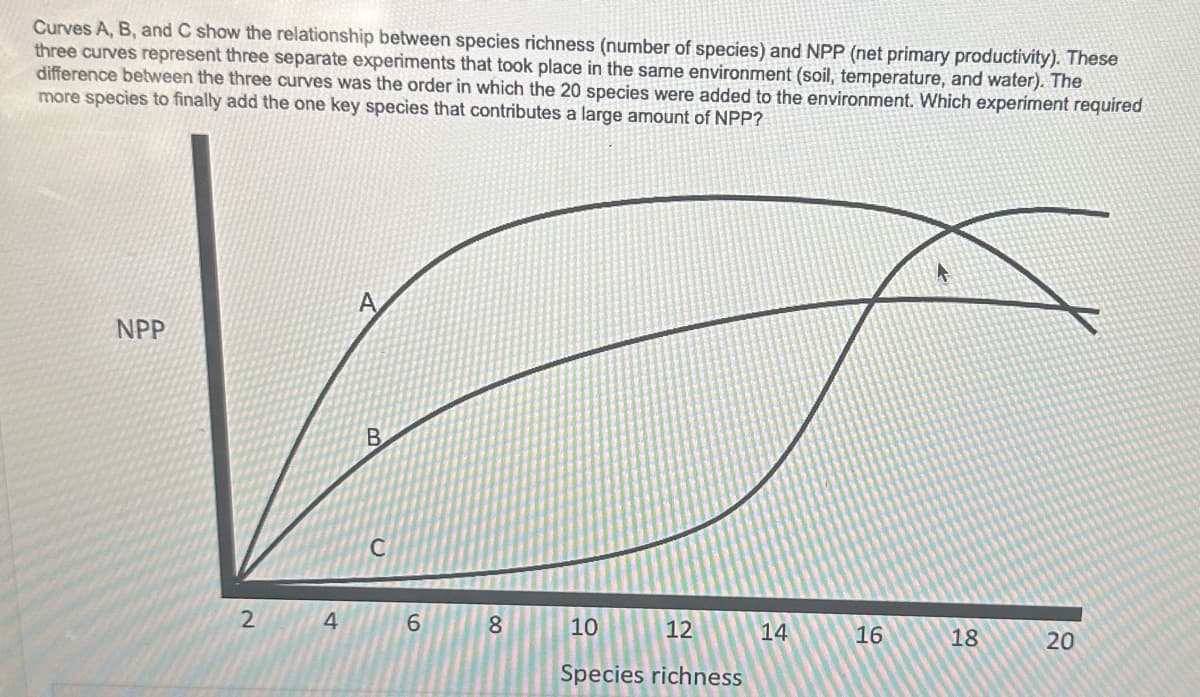
Curves A, B, and C show the relationship between species richness (number of species) and NPP (net primary productivity). These three curves represent three separate experiments that took place in the same environment (soil, temperature, and water). The difference between the three curves was the order in which the 20 species were added to the environment. Which experiment required more species to finally add the one key species that contributes a large amount of NPP?
Life Cycle Of Bryophytes
A group of plant species that utilize spores, instead of flowers or seeds, for reproduction is known as a bryophyte. The non-vascular seedless plants which include mosses, liverworts, and hornworts are classified as bryophytes. There are over 20,000 species of mosses, with some species being microscopic and others reaching heights of over one meter.
Plant Biometry
Biometry is the science that deals with the statistical investigation of biological observations and phenomena. It is very important in the development of sound and effective agricultural research practices. It is a Greek-derived word wherein 'bio' means life and 'metrics' means 'to measure'. Thus, it is generally defined as the combination of statistics and science. Water Weldon introduced this term. This method is applied in several fields of science, including botany, health, social and physical sciences, and humanities.
Life Cycle Of Gymnosperms
Gymnosperms, which translates to "naked seeds," are a diverse group of seed plants. The angiosperms are a sister group to one group of gymnosperms (the Gnetales), making the gymnosperms a paraphyletic group, according to the "anthophyte" hypothesis. The term "paraphyletic group" refers to a group that does not include all descendants of a single common ancestor. The "netifer" theory, on the other hand, indicates that Gnetophytes are sister to conifers, making gymnosperms monophyletic and sister to angiosperms. Further, molecular and anatomical research may shed light on these connections.
Life Cycle Of Pteridophytes
They are the first land plants with vascular tissues (xylem and phloem). These vascular plants are classified as vascular cryptogams because they do not contain flowers or seeds. These plants are the most common and visible group of land plants, accounting for more than 90% of all vegetation on the planet.
Life Cycle Of Angiosperms
An angiosperm is a word obtained from the two Greek words angio, which refers to "covered," and sperms, which means "bean". Flowering plants are what the angiosperms are called. The flowers of a plant develop into fruits, which contain seeds.


Trending now
This is a popular solution!
Step by step
Solved in 3 steps


