d) Calculate the coefficient of determination (r) and the coefficient of correlation (r). e) Using the linear regression equation that you developed in topic (b), calculate the estimated sales for a day that will reach 84 degrees F and for a day that will reach 94 F and for both temperature levels calculate the error "e" when comparing the estimated value against the actual data provided. At which of the two temperatures, is your model more accurate? Explain. f) Calculate an estimate for the variance (o?) and the standard deviation for the linear regression model you have developed.
Q: Theorem 3-8. For n events A1, A2, ..., A„ 11 P( 4)> U A; 2 E P (A;) – E P (A;^ A) i = 1 i = 1 1si<js...
A:
Q: 4) What is the maximum likelihood estimator l for the Normal distribution, assuming o is known? The ...
A: From the given information, fx=2πσ2-12e-x-μ22σ2 Consider, the likelihood function, L=∏i=1nfxi =∏i=1...
Q: T10.11. Researchers wondered whether maintaining a patient's body temperature close to normal by hea...
A: From the given information we find the solution.
Q: The average salary of bank managers in a certain city is $85,600 pesos per hour with a standard devi...
A: Let X be the random variable from normal distribution with average or mean (μ) =$ 85600 and standard...
Q: The average starting salary of students who graduated from colleges of Business in 2009 was $48,400....
A: Given : Sample size (n) = 100 Sample mean (X¯) = $50000 Population standard deviation (σ) = $8000
Q: Suppose x has a distribution with u = 19 and o = 14. A USE SALT (a) If a random sample of size n = 3...
A: Here, μ=19 and σ=14.
Q: For numbers 6-10, read and analyze the given problem, then solve for the following. The mean number ...
A: Since you have posted a question with multiple sub-parts, we will solve the first three subparts for...
Q: (a) Find the median. (b) Find the interquartile range (showing Q3 and Q1 in the process). (c) Find t...
A: Given: Since you have posted a question with multiple sub-parts, we will solve first three subparts ...
Q: Let {Xi}ni be IID from Gamma(α, λ). Find the method of moments estimator for α and λ and use simulat...
A: From the given information, X1,X2,.....Xn are iid from Grammaα,λ. For the given sample, EX=αλEX2=λα2...
Q: Adviser to 42 Member local charter of the national mathematics honor society At the end of the s...
A: Given,Total no.of members=25
Q: The points scored by teams in the first round of the Statistics Games have a mean of 135 points and ...
A:
Q: A fair coin is tossed twice. Let X be the number of tails that are observed. a.) Construct the proba...
A: Given that A fair coin is tossed twice . Number of trails (n) = 2 Total number of outcomes = 22 = 4...
Q: the number of observations and measurements taken is the sample size True or False
A: We have given that, the number of observations and measurements taken is the sample size? True or F...
Q: In 2013, 46% of high school students tried a tobacco product. From a survey of 500 randomly selecte...
A: Given : Population proportion =46% n=500
Q: A firm plans to bid $ 300 per kg. For a contract to supply 1,000 kg. Of a metal. It has two competit...
A:
Q: Which of the following statements about the mean are true? Check all that apply. These are the ans...
A: which one is the correct choice.
Q: Read and answer the following problems on hypothesis testing concerning proportions. (See the attach...
A: Introduction: Denote p as the true proportion of people in the population who are happy and contente...
Q: Find the margin of error for the given values of c, s, and n. c= 0.99, s = 5, n= 26 Click the icon t...
A:
Q: A shot is fired at a circular target. The vertical and horizontal co- ordinates of the point of impa...
A: Chi-squared distribution : The chi-squared distribution with k degrees of freedom is the distributio...
Q: 2. Using OLS or any other suitable method, Prove that E(ß1) = B1 E(ßo) = Bo
A:
Q: The following are the weights of 10 children admitted in a hospital on a particular day. Find the me...
A:
Q: Fwo events A and B, we have (i) P(Ā O B) = P (B) – P (A^ B) (ii) P (AnB ) = P(A) – P(A^ B)
A:
Q: On a planet far far away from Earth, IQ of the ruling species is normally distributed with a mean of...
A:
Q: 6. Your experiment is throwing two 6-sided dice and recording the outcome as a pair (i, ĵ), where i ...
A: “Since you have posted a question with multiple sub-parts, we will solve first three subparts for yo...
Q: 2. The dotplot shows rental prices per month for condos listed in three cities. The prices were obta...
A: Graphs like Histograms, dot plots help us to identify the center, shape and spread of the distributi...
Q: The table summarizes results from pedestrian deaths that were caused by automobile accidents. Pedest...
A: The contingency table is given as follows: Pedestrian Intoxicated? Driver Intoxicate...
Q: At a popular vacation spot in Arizona, the Arizona Tourism Board took a survey of 100 people to dete...
A: Complete the two way table and Find P ( who are from Arizona or who used a car ) = ? %
Q: An oil company estimates that only 1 well in 17 will yield commercial quantities of oil. Assume that...
A:
Q: The lengths of a professor's classes has a continuous uniform distribution between 49.2 min and 55.5...
A:
Q: Calculate the consumer price index number for 2015 on the basis of 2000 from the following data by u...
A:
Q: Q2. Here, the joint density function of two random variable X and Y are, (x,y) = {cCx*y* c(x*y² +x*y...
A:
Q: Determine whether the statement is true or false. If it is false, rewrite it as a true statement.
A: here , standard deviation of distribution of sample mean =σn
Q: The following histograms were created using the same motor fuel octane data. Compare the histograms....
A: A histogram is a graphical representation of data that indicates the shape, spread, and distribution...
Q: 1.The average salary of bank managers in a certain city is $91,900 pesos per hour with a standard de...
A:
Q: Problem 6: Use following Mega-Stat Output to solve this problem Binomial distribution ...
A: Since you have posted a question with multiple sub-parts, we will solve first three subparts for you...
Q: A pharmaceutical company makes tranquilizers. It is assumed that the distribution for the length of ...
A: Given data is 2.5,2.8,3.1,2.3,2.3,2.2,2.8,2.1,2.4sample size(n)=9
Q: Area I Area lI Age Group (in years) Population |No. of Deaths No. of Deaths Population 0-10 3000 55 ...
A: Given: Age Group Area I Area II Population No of ...
Q: a. Find the mean and standard deviation. b. What percentage of the data is within 1 standard deviati...
A: Here , A medical laboratory tested 8 samples of human blood for acidity on the pH scale(xi)
Q: The average salary of bank managers in a certain city is $85,600 pesos per hour with a standard devi...
A:
Q: 5. Show that if A and B are independent, then so are A and BC.
A:
Q: Find the area of the shaded region under the standard normal distribution to the right of the given ...
A:
Q: A box contains r red balls and b blue balls. One ball is selected at random and its color is observe...
A: Given We are given here an initial r red and blue balls in the box. Given that 4 balls are selected ...
Q: Calculate the range and the co-efficient of range for the marks obtained by 100 students in a school...
A:
Q: Does the following table represent the probability distribution for a discrete random variable? Expl...
A: We have given that, X be the random variable having probability mass function, X 1 2 3 4 5 6 ...
Q: How contagious and dangerous is the Delta variant? Medical study reports that viral loads in Delta i...
A:
Q: Apartment renting is one of the most affected business due to Covid Pandemic. It shows a reasonable ...
A: Given that n=49 , alpha =0.05 ,x bar = 280 , sigma = 40 ,mu =295 Carry out hypothesis test to determ...
Q: Determine the level of measurement for each of the following variables: a. The number of people in y...
A: Since you have posted a question with multiple subparts, we will solve first three subparts for you....
Q: Show that, given a 7-digit number, where all digits except perhaps the last is non-zero, you can cro...
A:
Q: pelow. Draw a suitable bar diagram. Amount (in lakhs) Expenditure Head School School II I Constructi...
A: Bar graph : A bar graph or bar chart could be a chart or graph that uses rectangular bars with heigh...
Q: SIMPLE convenience store is arranging a promotion plan for the next season. The marketing team wants...
A:
I need help answering parts D, E and F.
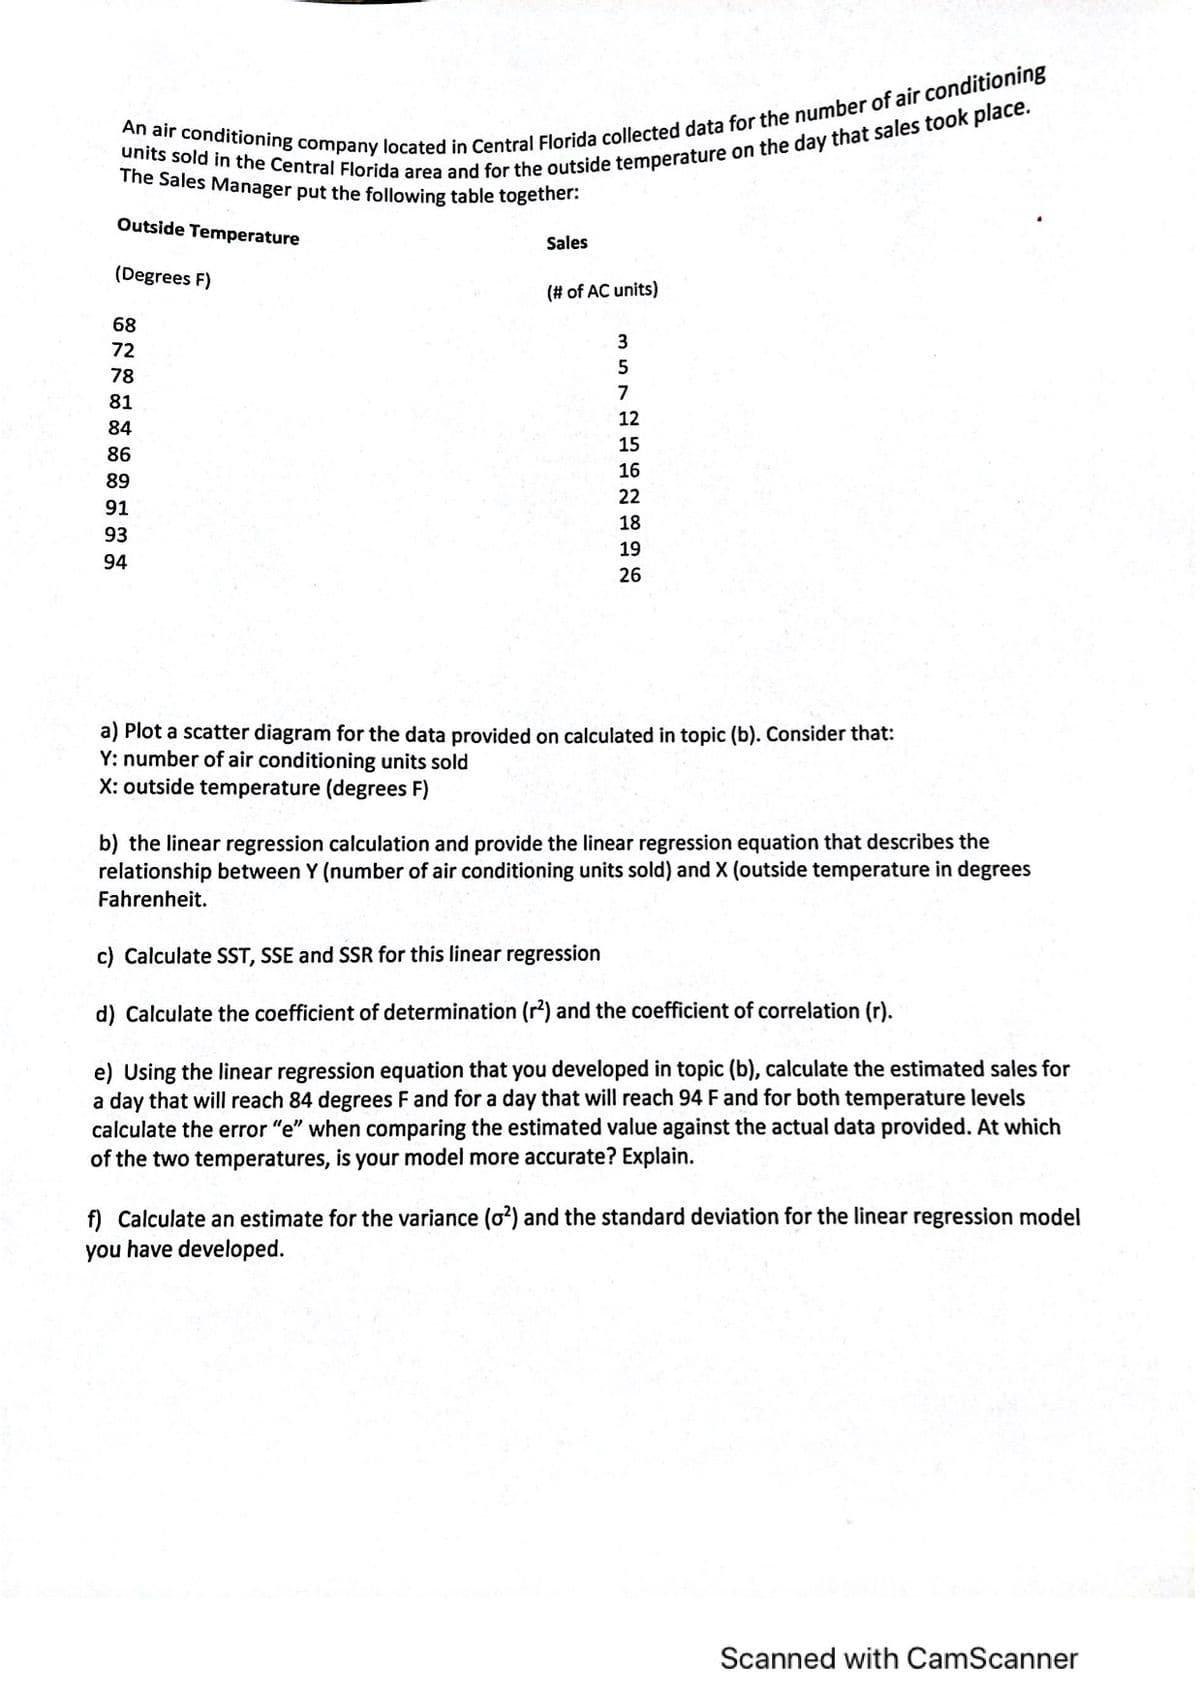
Step by step
Solved in 6 steps
- Interpret the estimated regression coefficient corresponding to the Z variable. Data Salary Education Experience Sex 29.7985 15 3 1 21.8219 4 0 0 22.8978 4 0 0 22.0917 1 1 0 21.8993 5 0 0 22.4829 3 1 1 28.0772 15 0 0 y=salary 23.6292 6 1 1 x1=education level in schooling years 32.3595 0 15 1 x2=experience level in employment level 21.794 1 0 0 d=sex (1 for male,0 for female) 19.8762 3 0 0 Ln(Y) = alpha +beta1X1 +Beta2X2+ Beta3D +Beta4Z +e 21.0253 3 0 0 where z =X2D 24.6323 0 5 1 19.0247 0 0 0 18.8857 0 0 0 21.8552 1 0 0 24.2675 6 1 0 18.7931 0 0 0 18.9276 0 0 0 23.4441 5 1 1 20.8047 2 0 0 18.26 0 0 0 20.6726 0 2 1 21.7815 3 0 0…The following table displays the mathematics test scores for a random sample ofcollege students, along with their final SY16C grades.a. Fit the regression line y=a+bx to the data and interpret the results.b. Use the regression equation to determine the SY16C grade for a college student whoscored 60 on their achievement test. What would their SY16C gradebe? Mathematics test(x) SY16C grades(y)1 39 652 43 783 21 524 64 825 57 926 47 897 28 738 75…A U.S. state's Bureau of Economic Geology published a study on the economic impact of using carbon dioxide enhanced oil recovery (EOR) technology to extract additional oil from fields that have reached the end of their conventional economic life. The following table gives the approximate number of jobs for the citizens that would be created at various levels of recovery. Percent Recovery (%) 20 40 80 100 Jobs Created (Millions) 6 9 12 18 Find the regression line. j(r) = Use the regression line to estimate the number of jobs that would be created at a recovery level of 60%. _____ million jobs
- A sales manager collected the following data on x = years of experience and y = annual sales ($1,000s). The estimated regression equation for these data is ŷ = 81 + 4x. Salesperson Years ofExperience Annual Sales($1,000s) 1 1 80 2 3 97 3 4 92 4 4 107 5 6 103 6 8 111 7 10 119 8 10 128 9 11 117 10 13 136 (a) Compute the residuals. Years ofExperience Annual Sales($1,000s) Residuals 1 80 3 97 4 92 4 107 6 103 8 111 10 119 10 128 11 117 13 136 Construct a residual plot. A residual plot has 10 points plotted on it. The horizontal axis ranges from 0 to 14 and is labeled: Years of Experience. The vertical axis ranges from −16 to 16 and is labeled: Residuals. There is a horizontal line that spans the graph at 0 on the vertical axis. There are 6 points below the line and 4 points above the line. The points are between 1 to 13 on the horizontal axis and appear to vary randomly between −8 to 10 on the vertical axis.…The table contains data on vehicle speed (h) and fuel consumption (lt / 100km) of 5 randomly selected vehicles. Estimate the average fuel consumption of a vehicle traveling at 45 km / h using the simple linear regression equation between vehicle speed and fuel consumption. Speed 55 60 65 70 75 Consumption 13 12 11 10 9 a. 15 b. 8 c. 7 d. 20The following table gives indices of industrial production of registered unemployed (in hundred thousand) Year: 2000 2001 2002 2003 2004 2005 2006 2007 Index of Production 100 102 104 107 105 112 103 99 No. unemployed 15 12 13 11 12 12 19 26 Required: Identify the dependent and the independent variables By first computing the regression coefficient “a” and “b”, state the regression equation of y on x. Sketch your results in (ii) above
- A sales manager collected the following data on x = years of experience and y = annual sales ($1,000s). The estimated regression equation for these data is ŷ = 81 + 4x. Salesperson Years ofExperience Annual Sales($1,000s) 1 1 80 2 3 97 3 4 97 4 4 107 5 6 103 6 8 101 7 10 119 8 10 123 9 11 127 10 13 136 (a) Compute the residuals. Years ofExperience Annual Sales($1,000s) Residuals 1 80 3 97 4 97 4 107 6 103 8 101 10 119 10 123 11 127 13 136 Construct a residual plot. A residual plot has 9 points plotted on it. The horizontal axis ranges from 0 to 14 and is labeled: Years of Experience. The vertical axis ranges from −16 to 16 and is labeled: Residuals. There is a horizontal line that spans the graph at 0 on the vertical axis. There are 3 points below the line, 5 points above the line, and 1 point on the line. The points are plotted from left to right in an upward, diagonal direction starting from the lower left…The table contains data on vehicle speed (h) and fuel consumption (lt / 100km) of 5 randomly selected vehicles. Estimate the average fuel consumption of a vehicle traveling at 45 km / h using the simple linear regression equation between vehicle speed and fuel consumption. Speed 55 60 65 70 75 Consumption 11 10 9 8 7 Please choose one: a. 6 b. 5 c. 13 D. 8A random sample of twelve students were chosen, and their midterm test score (y), as- signment score (x1), and missed classes (x2) were recorded as follows: Midterm Score, y Assignment Score, x1 Classes Missed, x2 85 74 76 90 85 87 94 98 81 91 76 74 65 50 55 65 55 70 65 70 55 70 50 55 5 7 5 2 6 3 2 5 4 3 1 4 (i) What is the fitted multiple linear regression equation of the form yˆ = b0 + b1x1 + b2x2? (ii) From part (i) above, estimate the midterm test score grade for a student who has an assignment score of 60 and missed 4 classes.
- A sales manager collected the following data on x = years of experience and y = annual sales ($1,000s). The estimated regression equation for these data is ŷ = 81 + 4x. Salesperson Years ofExperience Annual Sales($1,000s) 1 1 80 2 3 97 3 4 97 4 4 102 5 6 103 6 8 111 7 10 119 8 10 128 9 11 117 10 13 136 (a) Compute SST, SSR, and SSE. SST= SSR= SSE= (b) Compute the coefficient of determination r2. (Round your answer to three decimal places.) r2 = Comment on the goodness of fit. (For purposes of this exercise, consider a proportion large if it is at least 0.55.) The least squares line provided a good fit as a small proportion of the variability in y has been explained by the least squares line.The least squares line did not provide a good fit as a small proportion of the variability in y has been explained by the least squares line. The least squares line provided a good fit as a large proportion of the variability in y has been explained by the…A sales manager collected the following data on x = years of experience and y = annual sales ($1,000s). The estimated regression equation for these data is ŷ = 81 + 4x. Salesperson Years ofExperience Annual Sales($1,000s) 1 1 80 2 3 97 3 4 92 4 4 107 5 6 103 6 8 111 7 10 119 8 10 128 9 11 117 10 13 136 (a) Compute SST, SSR, and SSE. SST = SSR = SSE = (b) Compute the coefficient of determination r2. (Round your answer to three decimal places.) r2 = Comment on the goodness of fit. (For purposes of this exercise, consider a proportion large if it is at least 0.55.) The least squares line provided a good fit as a large proportion of the variability in y has been explained by the least squares line.The least squares line did not provide a good fit as a large proportion of the variability in y has been explained by the least squares line. The least squares line provided a good fit as a small proportion of the variability in y has been explained by the…It is believed that the annual repair cost for the sporty automobile Jeep is related to its age. A sample of 11 automobiles revealed the results in the table at the right. Car age (xi) 2 3 1 7 5 8 1 2 6 9 4 Repair cost (yi) in £ 72 99 65 138 67 140 83 101 170 121 114 Define the terms regression and correlation analysis . From the simple linear model ,y= a + bx ,determine parameters a and b