d) Construct a 95% prediction interval about the value of y if x = 4. Lower Bound Jpper Bound Round to one decimal place as needed.)
d) Construct a 95% prediction interval about the value of y if x = 4. Lower Bound Jpper Bound Round to one decimal place as needed.)

MATLAB: An Introduction with Applications
6th Edition
ISBN:9781119256830
Author:Amos Gilat
Publisher:Amos Gilat
Chapter1: Starting With Matlab
Section: Chapter Questions
Problem 1P

Related questions
Question
d
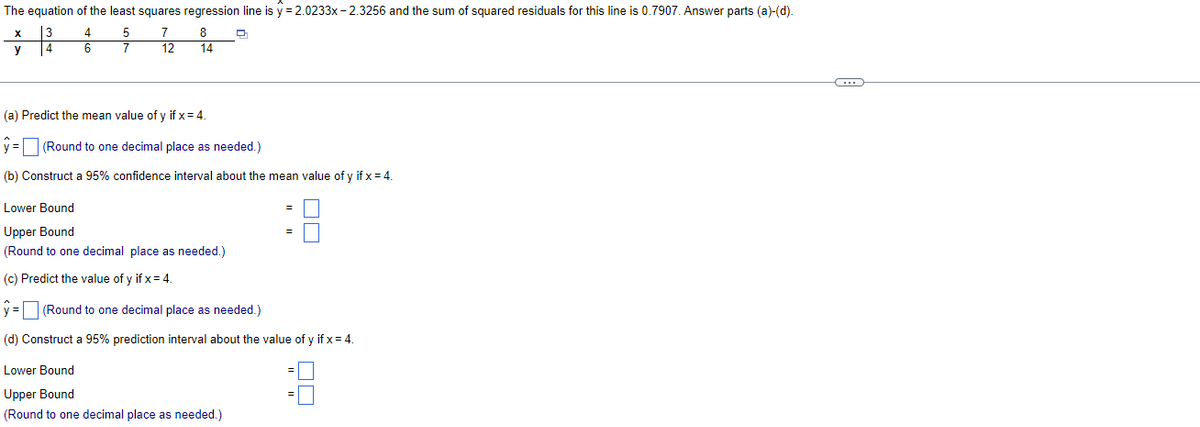
Transcribed Image Text:The equation of the least squares regression line is y = 2.0233x - 2.3256 and the sum of squared residuals for this line is 0.7907. Answer parts (a)-(d).
13
4
X
4
5
7
8
y
6
12
14
(a) Predict the mean value of y if x= 4.
y = (Round to one decimal place as needed.)
(b) Construct a 95% confidence interval about the mean value of y if x = 4.
Lower Bound
Upper Bound
(Round to one decimal place as needed.)
(c) Predict the value of y if x= 4.
y = (Round to one decimal place as needed.)
(d) Construct a 95% prediction interval about the value of y if x= 4.
Lower Bound
Upper Bound
(Round to one decimal place as needed.)
모모
Expert Solution
This question has been solved!
Explore an expertly crafted, step-by-step solution for a thorough understanding of key concepts.

Step by step
Solved in 2 steps with 1 images

Recommended textbooks for you
MATLAB: An Introduction with Applications
Statistics
ISBN:
9781119256830
Author:
Amos Gilat
Publisher:
John Wiley & Sons Inc

Probability and Statistics for Engineering and th…
Statistics
ISBN:
9781305251809
Author:
Jay L. Devore
Publisher:
Cengage Learning

Statistics for The Behavioral Sciences (MindTap C…
Statistics
ISBN:
9781305504912
Author:
Frederick J Gravetter, Larry B. Wallnau
Publisher:
Cengage Learning
MATLAB: An Introduction with Applications
Statistics
ISBN:
9781119256830
Author:
Amos Gilat
Publisher:
John Wiley & Sons Inc
Probability and Statistics for Engineering and th…
Statistics
ISBN:
9781305251809
Author:
Jay L. Devore
Publisher:
Cengage Learning
Statistics for The Behavioral Sciences (MindTap C…
Statistics
ISBN:
9781305504912
Author:
Frederick J Gravetter, Larry B. Wallnau
Publisher:
Cengage Learning

Elementary Statistics: Picturing the World (7th E…
Statistics
ISBN:
9780134683416
Author:
Ron Larson, Betsy Farber
Publisher:
PEARSON

The Basic Practice of Statistics
Statistics
ISBN:
9781319042578
Author:
David S. Moore, William I. Notz, Michael A. Fligner
Publisher:
W. H. Freeman

Introduction to the Practice of Statistics
Statistics
ISBN:
9781319013387
Author:
David S. Moore, George P. McCabe, Bruce A. Craig
Publisher:
W. H. Freeman