d) Construct the intervals ī±s, ī±2s,±3s. Count the number of observations that fall within each interval and find the corresponding proportions. Compare your results with that of Chebyshev's inequality. Do you detect any outliers? e) Find the 75th percentile for the data on total daily man-hours. f) Construt a stem and leaf display for the data and comment on it. 8) Construct a box-plot and comment on it.
d) Construct the intervals ī±s, ī±2s,±3s. Count the number of observations that fall within each interval and find the corresponding proportions. Compare your results with that of Chebyshev's inequality. Do you detect any outliers? e) Find the 75th percentile for the data on total daily man-hours. f) Construt a stem and leaf display for the data and comment on it. 8) Construct a box-plot and comment on it.

Algebra & Trigonometry with Analytic Geometry
13th Edition
ISBN:9781133382119
Author:Swokowski
Publisher:Swokowski
Chapter10: Sequences, Series, And Probability
Section10.2: Arithmetic Sequences
Problem 67E

Related questions
Question
Please answer (d,e,f,g) only.
Use Excel to calculate different statistical measures. You must include excel codes or steps of solving your assignment.
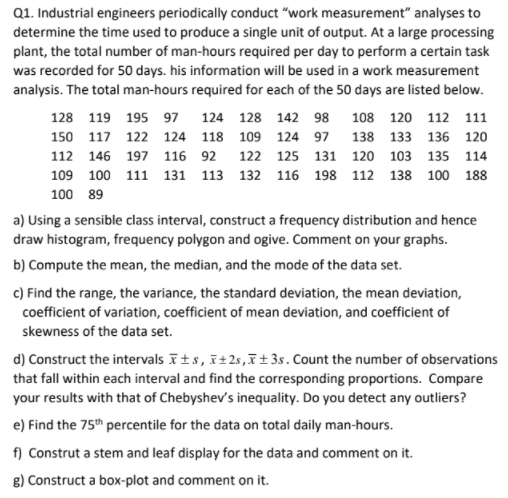
Transcribed Image Text:Q1. Industrial engineers periodically conduct “work measurement" analyses to
determine the time used to produce a single unit of output. At a large processing
plant, the total number of man-hours required per day to perform a certain task
was recorded for 50 days. his information will be used in a work measurement
analysis. The total man-hours required for each of the 50 days are listed below.
128 119 195 97
124 128 142 98
108 120 112 111
150 117 122 124 118 109 124 97 138 133 136 120
112 146 197 116 92 122 125 131 120 103 135 114
109 100 111 131 113 132 116 198 112 138 100 188
100 89
a) Using a sensible class interval, construct a frequency distribution and hence
draw histogram, frequency polygon and ogive. Comment on your graphs.
b) Compute the mean, the median, and the mode of the data set.
c) Find the range, the variance, the standard deviation, the mean deviation,
coefficient of variation, coefficient of mean deviation, and coefficient of
skewness of the data set.
d) Construct the intervals īts, ī±2s,ī±3s. Count the number of observations
that fall within each interval and find the corresponding proportions. Compare
your results with that of Chebyshev's inequality. Do you detect any outliers?
e) Find the 75th percentile for the data on total daily man-hours.
f) Construt a stem and leaf display for the data and comment on it.
g) Construct a box-plot and comment on it.
Expert Solution
This question has been solved!
Explore an expertly crafted, step-by-step solution for a thorough understanding of key concepts.

This is a popular solution!

Trending now
This is a popular solution!

Step by step
Solved in 7 steps with 2 images

Knowledge Booster


Learn more about
Need a deep-dive on the concept behind this application? Look no further. Learn more about this topic, statistics and related others by exploring similar questions and additional content below.Recommended textbooks for you
Algebra & Trigonometry with Analytic Geometry
Algebra
ISBN:
9781133382119
Author:
Swokowski
Publisher:
Cengage

Mathematics For Machine Technology
Advanced Math
ISBN:
9781337798310
Author:
Peterson, John.
Publisher:
Cengage Learning,

Algebra & Trigonometry with Analytic Geometry
Algebra
ISBN:
9781133382119
Author:
Swokowski
Publisher:
Cengage
Mathematics For Machine Technology
Advanced Math
ISBN:
9781337798310
Author:
Peterson, John.
Publisher:
Cengage Learning,

Glencoe Algebra 1, Student Edition, 9780079039897…
Algebra
ISBN:
9780079039897
Author:
Carter
Publisher:
McGraw Hill