(d) Create a cumulative frequency table for the data (e) Draw the cumulative frequency graph (f) Use your cumulative frequency graph to determine if the data is normally distributed or not? (g) Calculate: i) The mean and standard deviation. ii) The upper and lower quartile values; and iii) The inter-quartile range for the given data.
(d) Create a cumulative frequency table for the data (e) Draw the cumulative frequency graph (f) Use your cumulative frequency graph to determine if the data is normally distributed or not? (g) Calculate: i) The mean and standard deviation. ii) The upper and lower quartile values; and iii) The inter-quartile range for the given data.

Holt Mcdougal Larson Pre-algebra: Student Edition 2012
1st Edition
ISBN:9780547587776
Author:HOLT MCDOUGAL
Publisher:HOLT MCDOUGAL
Chapter11: Data Analysis And Probability
Section11.2: Box-and-whisker Plots
Problem 20E

Related questions
Question
I attached the table plz solve this
This is complete table so kindly solve (d, e, f and g part) only
This table is complete.
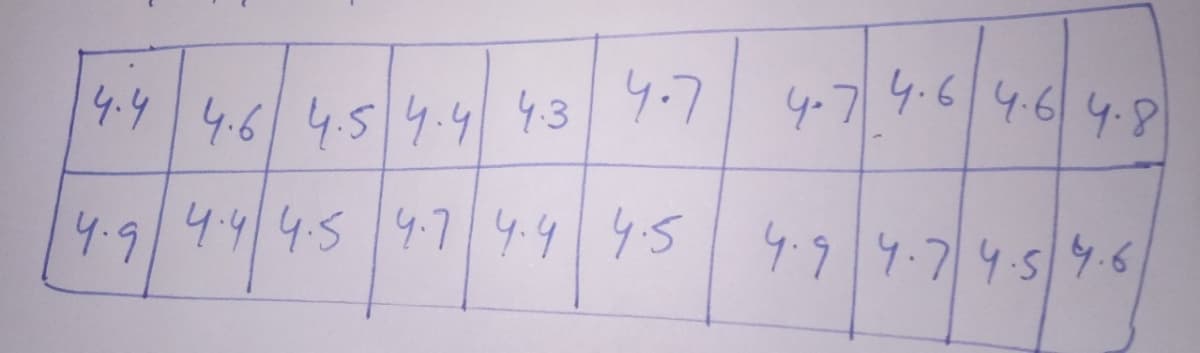
Transcribed Image Text:4.4 4.6 4.5 4.4 43 4.7
4.9 4.4 4.5 4.7 4.4 4.5
4.7 4.64.64.8
4.9 4.7 4.5 4.6
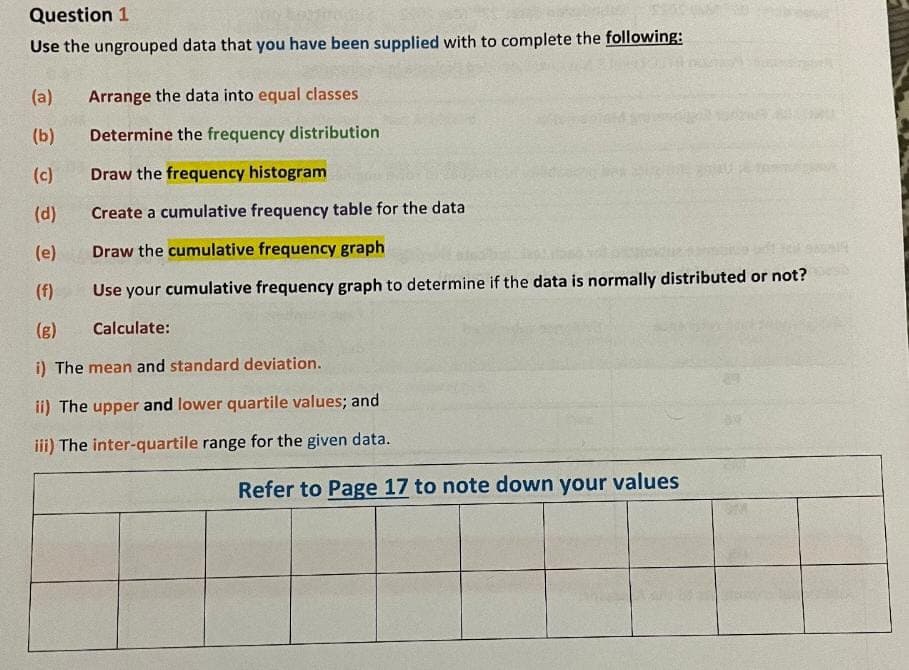
Transcribed Image Text:Question 1
Use the ungrouped data that you have been supplied with to complete the following:
(a)
Arrange the data into equal classes
(b)
Determine the frequency distribution
(c)
Draw the frequency histogram
(d)
Create a cumulative frequency table for the data
(e)
Draw the cumulative frequency graph
(f)
Use your cumulative frequency graph to determine if the data is normally distributed or not?
(g)
Calculate:
i) The mean and standard deviation.
ii) The upper and lower quartile values; and
iii) The inter-quartile range for the given data.
Refer to Page 17 to note down your values
Expert Solution
This question has been solved!
Explore an expertly crafted, step-by-step solution for a thorough understanding of key concepts.

Step by step
Solved in 4 steps with 3 images

Recommended textbooks for you
Holt Mcdougal Larson Pre-algebra: Student Edition…
Algebra
ISBN:
9780547587776
Author:
HOLT MCDOUGAL
Publisher:
HOLT MCDOUGAL

Algebra: Structure And Method, Book 1
Algebra
ISBN:
9780395977224
Author:
Richard G. Brown, Mary P. Dolciani, Robert H. Sorgenfrey, William L. Cole
Publisher:
McDougal Littell
Holt Mcdougal Larson Pre-algebra: Student Edition…
Algebra
ISBN:
9780547587776
Author:
HOLT MCDOUGAL
Publisher:
HOLT MCDOUGAL
Algebra: Structure And Method, Book 1
Algebra
ISBN:
9780395977224
Author:
Richard G. Brown, Mary P. Dolciani, Robert H. Sorgenfrey, William L. Cole
Publisher:
McDougal Littell