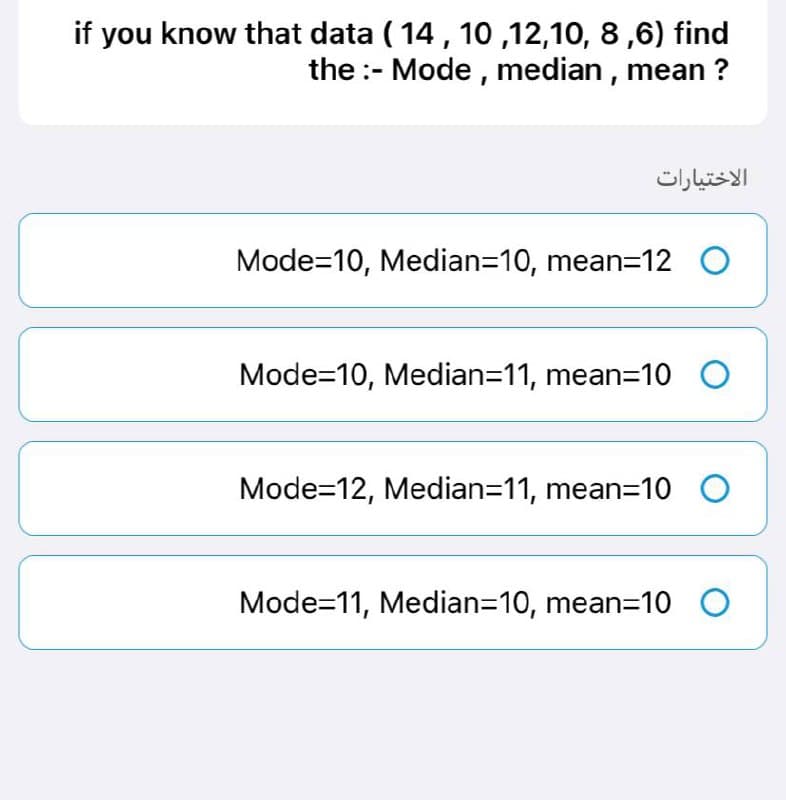
if you know that data (14, 10,12,10, 8,6) find the :- Mode, median, mean?


Q: Here are summary statistics for randomly selected weights of newborn girls: n=230, x=30.6 hg,…
A: Solution-: Given: x¯=30.6, n=230, s=7.3, c=0.95 We want to construct a C.I. estimate of the mean.
Q: Regardless of age, about 20% of American adults participate in fitness activities at least twice a…
A:
Q: he expected value of g(X,Y) = XY. Determine the covariance of X and Y. Determin
A: x f(x,y) 1 2 3 h(y) y 1 0.05 0.05 0.1 0.2 2 0.05 0.1 0.35 0.5 3 0 0.2 0.1 0.3 g(x)…
Q: If a regression equation is used, when are predictions not meaningful?
A: A regression equation is used in statistics to calculate the relationship, which, exists between…
Q: A union of restaurant and foodservice workers would like to estimate the mean hourly wage, μ, of…
A: Solution Given That, A union of restaurant and foodservice workers would like to estimate the mean…
Q: On average, Americans have lived in 2 places by the time they are 18 years old. Is this average less…
A: Given Mean=2 x-bar=1.99 Standard deviations=0.3 n=62
Q: Jump to level 1 A city council is trying to determine if library B, with extended hours, has a…
A:
Q: Finish times to the nearest hour for 57 dog sled teams are shown below. Use 5 classes. Categorize a…
A: Given: Finish times to the nearest hour for 57 dog sled teams
Q: g. Determine the variance of X². h. Determine the variance of Y².
A:
Q: Q1/ Grades in statistics class are weighted as follows: Tests are worth 50% of grade, homework is…
A: Given that: Grade in test, X1 = 80 Grade in homework, X2 = 100 Grade in final, X3 = 85 Weightage of…
Q: TI-83/84 PLUS Winning team data were collected for teams in different sports, with the results given…
A: Given Information: Significance level α=0.05 Claim: Home/visitor wins are independent of the sport.…
Q: 3. Suppose the Road Transport and Safety Agency wants to examine the safety of compact cars, midsize…
A: Since you have posted a question with multiple subparts, we will solve first three subparts for you.…
Q: Determine the range, mean, and standard deviation of the data set. (9,5,9,17,17,16,3,8) The range is…
A: Given data set is 9,5,9,17,17,16,3,8sample size(n)=8
Q: hat is the critical value needed to compute the margin of error for a confidence interval for \muμ…
A: Given that Confidence level (C) = 99% = 0.99 Level of significance (α) = (1-C) = (1-0.99) = 0.01…
Q: A company that develops an automated customer service model is interested in knowing whether two…
A: The hypothesis test for the difference between two population means is,
Q: A manufacturer knows that their items have a lengths that are skewed right, with a mean of 5 inches,…
A: Given: Population mean = 5 inches Population standard deviation = 0.7 inches Sample size = 37 To…
Q: =(x, y) = { √x² +²2²2²,0 < x < 1,0 < y < 2, elsewhere. 0, (x)= 2x (x + 1/3), h(y)= 1/3 + y/6. g.…
A:
Q: celebrations was 72, with a standard deviation of 9.4. If appropriate, use this inf celebrations. 14…
A: The random sample of 41 veterans day with mean 72 and standard deviation 9.4 n=41x=72s=9.4α=0.02
Q: The table below gives the amount of time students in a class studied for a test and their test…
A: Use EXCEL to obtain the value correlation coefficient r: EXCEL procedure: Go to EXCEL Go to…
Q: in a certain lottery, 5 different numbers between 1 and 34 inclusive are drawn. these are the…
A: There is total 34 numbers, from 1 to 34 inclusively.
Q: Do these facts reveal a significant difference between the two dis- tricts (use 5% level)?
A:
Q: if the probability of a machine producing a defective part is 0.05, what is the probability of…
A: Given Sample size=100 Exactly five defective X=5 P=0.05
Q: Part 4 of 4 Which is smaller? Explain why. The confidence is smaller since there is (Choose one) of…
A: Given that: Mean, μ=6.8 91% confidence interval of mean: 6.2<μ<7.4 95% confidence interval of…
Q: A state housing department is trying to determine if housing prices in county B are lower than in…
A:
Q: There is a claim that playing e-sport increase food intake. The following table (Table 2) shows data…
A:
Q: distributed
A:
Q: A population of values has a normal distribution with μ=43.4μ=43.4 and σ=56.1σ=56.1. You intend to…
A: Solution
Q: ump to level 1 ompany would like to know if efficiency can be improved through a training course for…
A:
Q: Assume that a sample is used to estimate a population mean μμ. Find the 99.9% confidence interval…
A:
Q: As determined from long experience, the number of automobiles rented per hour, X, at the Rent-A Car…
A: Solution-: Let, X=Automobiles Rented and P(X)=Probability We have following table: X P(X) 0…
Q: In a study of variables that affect productivity in the retail grocery trade, W.S. Good uses value…
A: Use the Excel and Perform the Regression. Followings are the Steps to perform the Regression 1) Open…
Q: In a study of treatments for very painful "cluster" headaches, 151 patients were treated with oxygen…
A: Given Information: Oxygen treatment group: Sample size n1=151 Successes x1=110 Placebo: Sample size…
Q: a) z> 1.5 b) z <1.5 c) - 1.4<<<0.95
A: Here AS PER POLICY I HAVE CALCULATED FIRST 3 SUBPART PLZ REPOST FOR REMAINING PARTS WITH NOTE I NEED…
Q: Suppose that the relevant equilibrium model is CAPM with unlimited borrowing and lending at a…
A:
Q: Sample Designs: Test one group against another group of experiment on the same reaction time test…
A: The procedure for a reaction time test using a ruler: 1) Two volunteers are required for the…
Q: The number of white corpuscles on a slide has a Poisson distribution with a mean of 4.5. a. Find the…
A: Given Mean = 4.5
Q: According to the study, the average number of hours that the student spent studying per week in the…
A: From the provided information, Mean (µ) = 56 hours Standard deviation (σ) = 14 hours X~N (56, 14)
Q: One personality test available on the World Wide Web has a subsection designed to assess the…
A:
Q: f(x, y) y 1 3 1 0.05 0.05 0.00 2 0.05 0.10 03 3 0.10 0.35 0.10
A: The table is as follows x f(x,y) 1 2 3 h(y) 1 0.05 0.05 0.1 0.2 y 3 0.05 0.1…
Q: Among the first-year resident students, eight students were randomly selected, and their body…
A: Given that Level of significance =0.05 We have to conduct hypothesis testing for the claim that…
Q: Because of practical considerations you ultimately decide to survey 100 people and find that 75 of…
A: Solution-: Number of people in survey =100 Number of people prefer to work at home = 75 We want to…
Q: Find the value of z that has 72% of the standard normal distribution's area to its left. Report your…
A: “Since you have asked multiple questions, we will solve the first question for you. If you want any…
Q: Calculate the mean median mode and standard deviation of the data 21,30, 27, 30, 25
A: Given data is21,30,27,30,25sample size(n)=5
Q: In the country of United States of Heightlandia, the height measurements of ten-year-old children…
A: Given: Population mean = 55.1 Population standard deviation = 7.4
Q: What is the simple regression line that can best predict the sales from the advertising expenditures…
A:
Q: A survey is commissioned to study the weight of NFL players at certain positions. Of the 188 active…
A: The sample size is n=36. The sample mean is X¯=189.3 The population standard deviation is σ=4.7
Q: The consumption function captures one of the key relationships in economics. It expresses…
A: Solution Given information is The consumption function captures one of the key relationships in…
Q: 5. Ho: u=215 Ha 215 The population is approximately normal. The sample mean is 219.3, the sample…
A: Since you have posted a question with multiple subparts, we will solve first three subparts for you.…
Q: The accompanying data are the number of wins and the earned run averages (mean number of earned runs…
A: Given: Wins (x) Earned run average (y) xy x^2 y^2 20 2.72 54.4 400 7.3984 18 3.26 58.68…
Q: f(x, y) = = {x(x² + y²) +y²) 20 ≤x≤ 30, 20 ≤ y ≤ 30 otherwise (a) Determine the conditional pdf of Y…
A: Solution Given That, Each front tire on a particular type of vehicle is supposed to be filled to a…


Trending now
This is a popular solution!

Step by step
Solved in 2 steps

- In 2013 students from a Statistics class at FSEV UK were asked to survey their friends who were 15-30 years old, in order to explore the interests of young people. The survey has a variety of questions, which are detailed in the Survey Key. For example, the column header “Music” is short for the question “I enjoy listening to music” and is rated 1-5, where 1 represents strongly disagree and 5 represents strongly agree. There is also some categorical data present as well. Survey participants record their gender, how often they smoke/drink, their internet usage, and education (just to name a few!). Please perform a hypothesis test based on one of the categorical variables and one survey question. For example, you could choose to prove the following: Survey participants who identify as an “only child” enjoy meeting new people (Survey score ). Here is an example: people who are right-handed (as identified in the data set) enjoy listening to music. Please be sure to use two columns…Compute the mean, median, and mode of the data sample. (If every number of the set is a solution, enter EVERY in the answer box.) 3, 1, 7, −4, 0, 5 mean median modewhat kind of statistical data might a barglar alarm company employ in trying to convince urdban homeowers to purchase its products
- Based on the given data in the yellowpad, using the computed values for population and sample mean and variance, create a problem and question similar to the sample activity. Provide the answers and solution too. note : - make it like a situational problem like the sample activityGive 2 examples of Measures of central tendency to ungrouped data and how to solve itI use the calculator command 2-PropZInt and 2-PropZTest if I collect [ Select ] ["one sample", "two samples"] of [ Select ] ["quantitative", "categorical (2 categories)"] data.
- A researcher wants to compare the effectiveness of three different teaching methods (A, B, and C) on exam scores. The researcher gathers exam scores from 20 students for each teaching method, and wants to determine if there is a significant difference in the mean exam scores between the three teaching methods. What test can the researcher use to answer this question?2. Report the statistical results for a three sets of data in APA style.The American Water Works Association reports that, The average household water usage is more than 10 gallons per day. However, in a pandemic like this, it is suspected that there is a change in household water consumption. A researcher conducted a survey and took samples of 12 household heads and asked about the use of the gallon water. The data obtained are as follows: 74, 8, 13, 17, 13, 15, 12, 13, 15, 16, 9, 7. If it is known that the data is normally distributed. Use a significance level of 5% to test whether the average household water use has increased (greater than 10 gallons)? What will happen if the household's water use increases by 5% from the previous one? Analyze your answer and come up with a conclusion!
- The Following are Data for Systolic Blood Pressures, in mm of Mercury, of 12 Chimpanzees. 121, 125, 128, 134, 136, 138, 139, 141,144, 145, 149, 151 Based on this sample, do chimps have higher systolic blood pressure than humans, their closest relatives? Make sure you state the statistical hypotheses and conclusions, as well as the biological conclusions.The best measure of central tendency for systolic blood pressure readings obtained from a population of 7 individuals whose systolic blood pressure readings were 101, 104, 108, 109, 111, 112, and 160 is the mean. Is it?An interviewer stops people on the street to do a survey concerning illegal drug use. How can this give bias data and how can it be more reliably collected?
