(d) How many percent of the students have their grades within two standard deviations considering the actua data? Compare the determined peržentage with Chebyshev's rule. (e) Determine the z-score of the lowest and the highest grades among the population. (f) What should be the minimum grade of the student in order for him/her to have a grade: (f.1) higher than 60% of the student population? (f.2) higher than 75% of the student population? (f.3) higher than 85% of the student population? Consider the frequency distribution from (b) for the calculations.
(d) How many percent of the students have their grades within two standard deviations considering the actua data? Compare the determined peržentage with Chebyshev's rule. (e) Determine the z-score of the lowest and the highest grades among the population. (f) What should be the minimum grade of the student in order for him/her to have a grade: (f.1) higher than 60% of the student population? (f.2) higher than 75% of the student population? (f.3) higher than 85% of the student population? Consider the frequency distribution from (b) for the calculations.

MATLAB: An Introduction with Applications
6th Edition
ISBN:9781119256830
Author:Amos Gilat
Publisher:Amos Gilat
Chapter1: Starting With Matlab
Section: Chapter Questions
Problem 1P

Related questions
Question
Please answer d, e , f
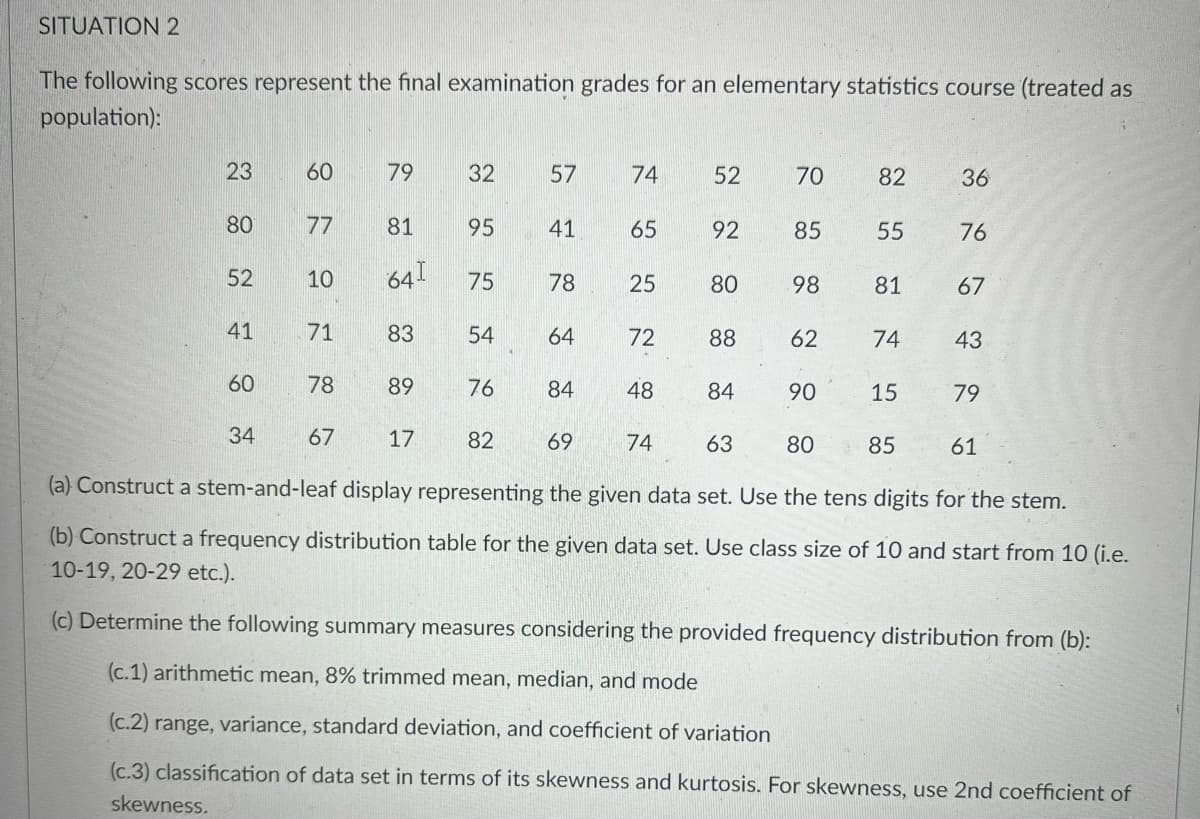
Transcribed Image Text:SITUATION 2
The following scores represent the final examination grades for an elementary statistics course (treated as
population):
23
60
79
32
57
74
52
70
82
36
80
77
81
95
41
65
92
85
55
76
52
10
64!
75
78
25
80
98
81
67
41
71
83
54
64
72
88
62
74
43
60
78
89
76
84
48
84
90
15
79
34
67
17
82
69
63
80
85
61
(a) Construct a stem-and-leaf display representing the given data set. Use the tens digits for the stem.
(b) Construct a frequency distribution table for the given data set. Use class size of 10 and start from 10 (i.e.
10-19, 20-29 etc.).
(c) Determine the following summary measures considering the provided frequency distribution from (b):
(c.1) arithmetic mean, 8% trimmed mean, median, and mode
(c.2) range, variance, standard deviation, and coefficient of variation
(c.3) classification of data set in terms of its skewness and kurtosis. For skewness, use 2nd coefficient of
skewness.
74
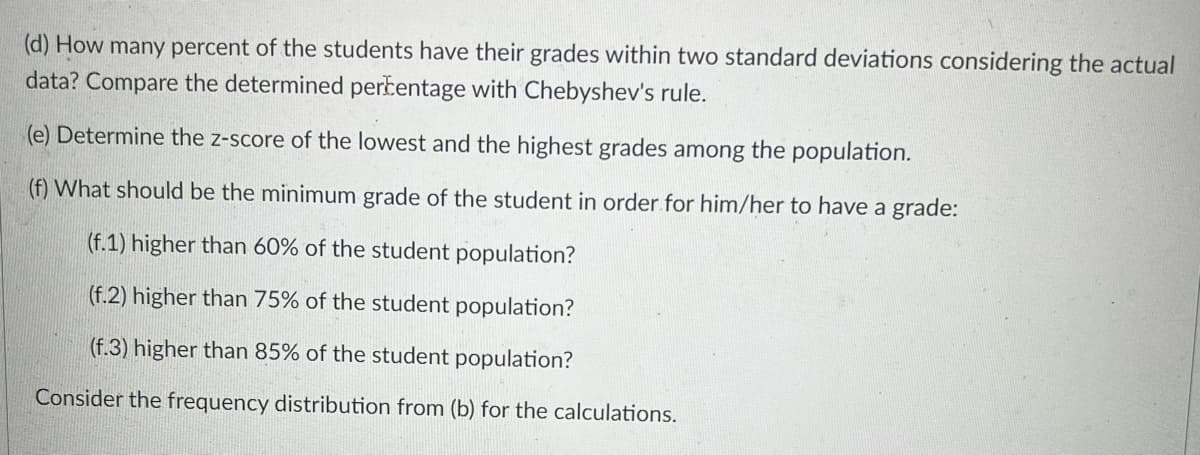
Transcribed Image Text:(d) How many percent of the students have their grades within two standard deviations considering the actual
data? Compare the determined perkentage with Chebyshev's rule.
(e) Determine the z-score of the lowest and the highest grades among the population.
(f) What should be the minimum grade of the student in order for him/her to have a grade:
(f.1) higher than 60% of the student population?
(f.2) higher than 75% of the student population?
(f.3) higher than 85% of the student population?
Consider the frequency distribution from (b) for the calculations.
Expert Solution
This question has been solved!
Explore an expertly crafted, step-by-step solution for a thorough understanding of key concepts.

Step by step
Solved in 3 steps

Recommended textbooks for you
MATLAB: An Introduction with Applications
Statistics
ISBN:
9781119256830
Author:
Amos Gilat
Publisher:
John Wiley & Sons Inc

Probability and Statistics for Engineering and th…
Statistics
ISBN:
9781305251809
Author:
Jay L. Devore
Publisher:
Cengage Learning

Statistics for The Behavioral Sciences (MindTap C…
Statistics
ISBN:
9781305504912
Author:
Frederick J Gravetter, Larry B. Wallnau
Publisher:
Cengage Learning
MATLAB: An Introduction with Applications
Statistics
ISBN:
9781119256830
Author:
Amos Gilat
Publisher:
John Wiley & Sons Inc
Probability and Statistics for Engineering and th…
Statistics
ISBN:
9781305251809
Author:
Jay L. Devore
Publisher:
Cengage Learning
Statistics for The Behavioral Sciences (MindTap C…
Statistics
ISBN:
9781305504912
Author:
Frederick J Gravetter, Larry B. Wallnau
Publisher:
Cengage Learning

Elementary Statistics: Picturing the World (7th E…
Statistics
ISBN:
9780134683416
Author:
Ron Larson, Betsy Farber
Publisher:
PEARSON

The Basic Practice of Statistics
Statistics
ISBN:
9781319042578
Author:
David S. Moore, William I. Notz, Michael A. Fligner
Publisher:
W. H. Freeman

Introduction to the Practice of Statistics
Statistics
ISBN:
9781319013387
Author:
David S. Moore, George P. McCabe, Bruce A. Craig
Publisher:
W. H. Freeman