d) If they stop 30 cars during the first hour, find the mean and standard deviation of the number of drivers not expected to be wearing seatbelts? e) If they stop 120 cars during this safety check, what is the probability they find at least 12 drivers not wearing seatbelts?
d) If they stop 30 cars during the first hour, find the mean and standard deviation of the number of drivers not expected to be wearing seatbelts? e) If they stop 120 cars during this safety check, what is the probability they find at least 12 drivers not wearing seatbelts?
Holt Mcdougal Larson Pre-algebra: Student Edition 2012
1st Edition
ISBN:9780547587776
Author:HOLT MCDOUGAL
Publisher:HOLT MCDOUGAL
Chapter11: Data Analysis And Probability
Section11.5: Interpreting Data
Problem 1C
Related questions
Topic Video
Question
Please help with questions D and E.
Thanks

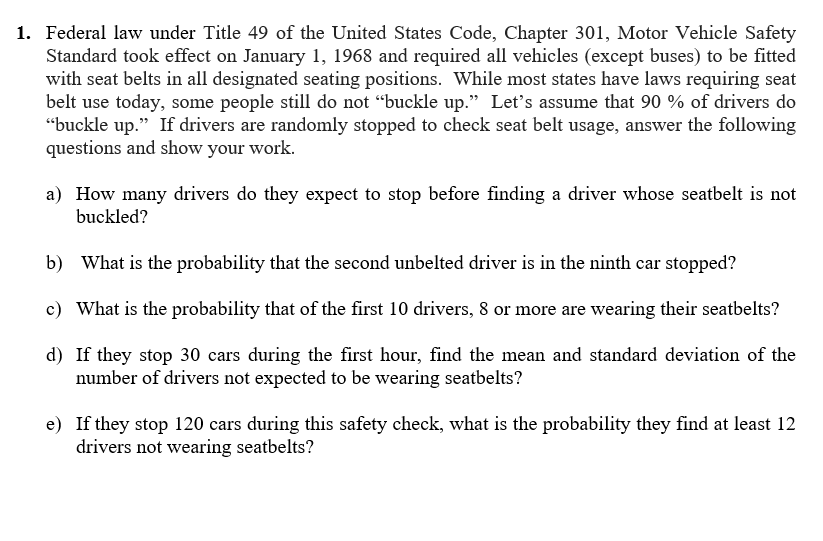
Transcribed Image Text:1. Federal law under Title 49 of the United States Code, Chapter 301, Motor Vehicle Safety
Standard took effect on January 1, 1968 and required all vehicles (except buses) to be fitted
with seat belts in all designated seating positions. While most states have laws requiring seat
belt use today, some people still do not “buckle up." Let's assume that 90 % of drivers do
"buckle up." If drivers are randomly stopped to check seat belt usage, answer the following
questions and show your work.
a) How many drivers do they expect to stop before finding a driver whose seatbelt is not
buckled?
b) What is the probability that the second unbelted driver is in the ninth car stopped?
c) What is the probability that of the first 10 drivers, 8 or more are wearing their seatbelts?
d) If they stop 30 cars during the first hour, find the mean and standard deviation of the
number of drivers not expected to be wearing seatbelts?
e) If they stop 120 cars during this safety check, what is the probability they find at least 12
drivers not wearing seatbelts?
Expert Solution
Step 1
Given Information:
90% of drivers do "buckle up" (wearing seat belts).
(d) If they stop 30 cars during the first hour, we are asked to find the mean and standard deviation of the number of drivers not expected to be wearing seatbelts:
If , then
Let X be a Binomial random variable with parameters and
Mean or Expected value of Binomial variable is given as:
Thus, the mean of the number of drivers not expected to be wearing seatbelts is 3
Standard deviation is calculated using the formula:
Thus, the standard deviation of the number of drivers not expected to be wearing seatbelts is 1.6432
Trending now
This is a popular solution!
Step by step
Solved in 2 steps

Knowledge Booster
Learn more about
Need a deep-dive on the concept behind this application? Look no further. Learn more about this topic, statistics and related others by exploring similar questions and additional content below.Recommended textbooks for you

Holt Mcdougal Larson Pre-algebra: Student Edition…
Algebra
ISBN:
9780547587776
Author:
HOLT MCDOUGAL
Publisher:
HOLT MCDOUGAL

Holt Mcdougal Larson Pre-algebra: Student Edition…
Algebra
ISBN:
9780547587776
Author:
HOLT MCDOUGAL
Publisher:
HOLT MCDOUGAL