d) Name a better sampling method the principal could use. Describe how this sample could be collected. e) The principal has decided to plot the results using a graph. Name an appropriate graph he could use to visualize the data.
d) Name a better sampling method the principal could use. Describe how this sample could be collected. e) The principal has decided to plot the results using a graph. Name an appropriate graph he could use to visualize the data.

College Algebra (MindTap Course List)
12th Edition
ISBN:9781305652231
Author:R. David Gustafson, Jeff Hughes
Publisher:R. David Gustafson, Jeff Hughes
Chapter8: Sequences, Series, And Probability
Section8.7: Probability
Problem 5E: List the sample space of each experiment. Rolling one die and tossing one coin

Related questions
Question
There is no actual data set it is a conceptual problem, please do only parts D and E, you should be able to accomplish with given photo
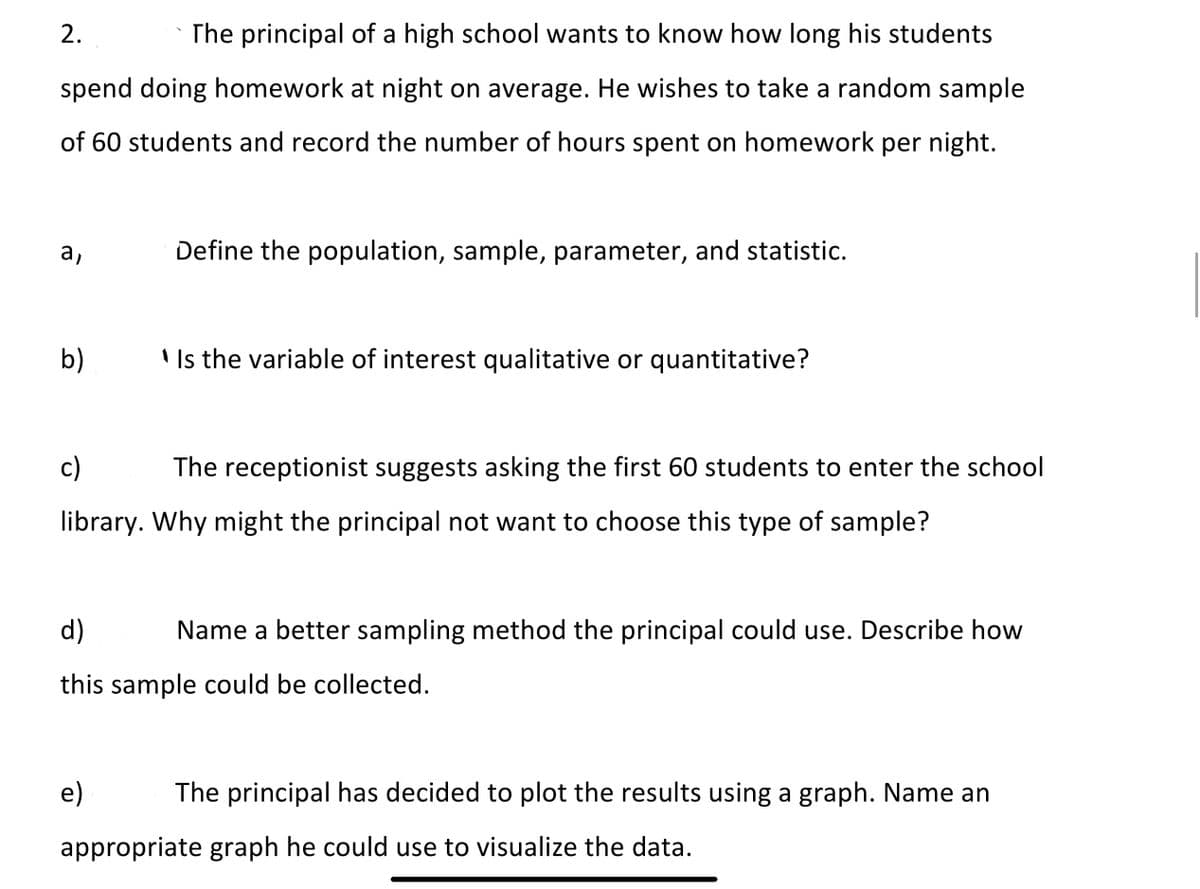
Transcribed Image Text:2.
The principal of a high school wants to know how long his students
spend doing homework at night on average. He wishes to take a random sample
of 60 students and record the number of hours spent on homework per night.
Define the population, sample, parameter, and statistic.
b)
' Is the variable of interest qualitative or quantitative?
c)
The receptionist suggests asking the first 60 students to enter the school
library. Why might the principal not want to choose this type of sample?
d)
Name a better sampling method the principal could use. Describe how
this sample could be collected.
e)
The principal has decided to plot the results using a graph. Name an
appropriate graph he could use to visualize the data.
Expert Solution
Introduction
Sampling is the method is a way which used to make sample. There are two types of sampling, they are probability sampling and the non probability sampling. Probability sampling gives equal chances to all the observation. Non probability sample does not provide equal chance to all the observation.

Trending now
This is a popular solution!

Step by step
Solved in 2 steps

Recommended textbooks for you
College Algebra (MindTap Course List)
Algebra
ISBN:
9781305652231
Author:
R. David Gustafson, Jeff Hughes
Publisher:
Cengage Learning

Glencoe Algebra 1, Student Edition, 9780079039897…
Algebra
ISBN:
9780079039897
Author:
Carter
Publisher:
McGraw Hill

College Algebra (MindTap Course List)
Algebra
ISBN:
9781305652231
Author:
R. David Gustafson, Jeff Hughes
Publisher:
Cengage Learning
Glencoe Algebra 1, Student Edition, 9780079039897…
Algebra
ISBN:
9780079039897
Author:
Carter
Publisher:
McGraw Hill