(d) Suppose it had previously been believed that when air void increased by 1 percent, the associated true average change in dielectric constant would be at least -0.057. Does the sample data contradict this belief? Carry out a test of appropriate hypotheses using a significance level of 0.01 State the appropriate null and alternative hypotheses. O Ho: B, -0.057 H: 8, > -0.057 O H: 8, -0.057 H: 8, = -0.057 O H,: 8, = -0.057 H:8, < -0.057 O H: 8,- -0.057 H,1 8, -0.057 Compute the test statistic value and find the P-value. (Round your test statistic to two decimal places and your P-value to three decimal places.) Prvalue = State the conclusion in the problem context. O Reject H. There is insufficient evidence to contradict the prior belief. O Reject H,. There is sufficient evidence to contradict the prior belief. O Fail to reject H. There is insufficient evidence to contradict the prior belief. O Fail to reject H. There is sufficient evidence to contradict the prior belief.
(d) Suppose it had previously been believed that when air void increased by 1 percent, the associated true average change in dielectric constant would be at least -0.057. Does the sample data contradict this belief? Carry out a test of appropriate hypotheses using a significance level of 0.01 State the appropriate null and alternative hypotheses. O Ho: B, -0.057 H: 8, > -0.057 O H: 8, -0.057 H: 8, = -0.057 O H,: 8, = -0.057 H:8, < -0.057 O H: 8,- -0.057 H,1 8, -0.057 Compute the test statistic value and find the P-value. (Round your test statistic to two decimal places and your P-value to three decimal places.) Prvalue = State the conclusion in the problem context. O Reject H. There is insufficient evidence to contradict the prior belief. O Reject H,. There is sufficient evidence to contradict the prior belief. O Fail to reject H. There is insufficient evidence to contradict the prior belief. O Fail to reject H. There is sufficient evidence to contradict the prior belief.

Algebra & Trigonometry with Analytic Geometry
13th Edition
ISBN:9781133382119
Author:Swokowski
Publisher:Swokowski
Chapter7: Analytic Trigonometry
Section7.6: The Inverse Trigonometric Functions
Problem 92E

Related questions
Question
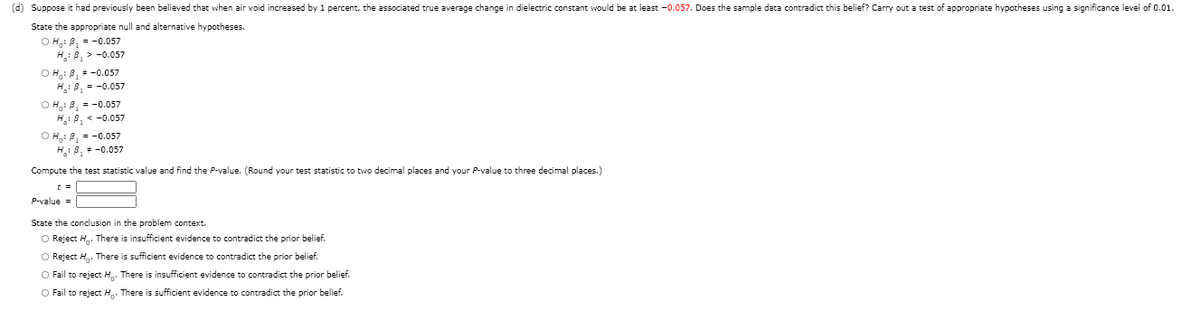
Transcribed Image Text:(d) Suppose it had previously been believed that when air void increased by 1 percent, the associated true average change in dielectric constant would be at least -0.057. Does the sample data contradict this belief? Carry out a test of appropriate hypotheses using a significance level of 0.01.
State the appropriate null and alternative hypotheses.
O H.: B, = -0.057
H.: A, > -0.057
O H,: B, = -0.057
H: B, = -0.057
O H: B, = -0.057
H: B, < -0.057
O H: B, = -0.057
H: 8, -0.057
Compute the test statistic value and find the P-value. (Round your test statistic to two decimal places and your P-value to three decimal places.)
P-value =
State the conclusion in the problem context.
O Reject H. There is insufficient evidence to contradict the prior belief.
O Reject H. There is sufficient evidence to contradict the prior belief.
O Fail to reject H. There is insufficient evidence to contradict the prior belief.
O Fail to reject H. There is sufficient evidence to contradict the prior belief.
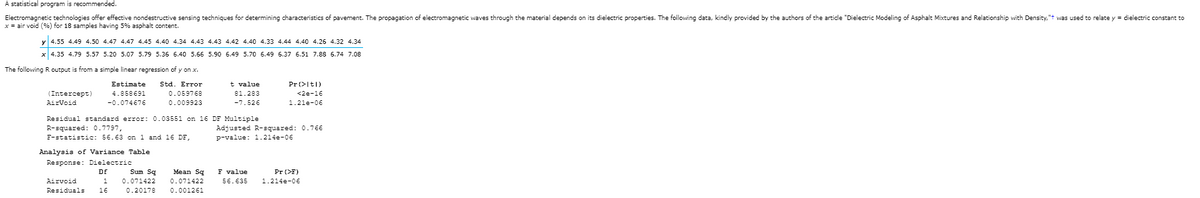
Transcribed Image Text:A statistical program is recommended.
Electromagnetic technologies offer effective nondestructive sensing techniques for determining characteristics of pavement. The propagation of electromagnetic waves through the material depends on its dielectric properties. The following data, kindly provided by the authors of the article "Dielectric Modeling of Asphalt Mixtures and Relationship with Density,"t was used to relate y = dielectric constant to
x = air void (%) for 18 samples having 5% asphalt content.
y 4.55 4.49 4.50 4.47 4.47 4.45 4.40 4.34 4.43 4.43 4.42 4.40 4.33 4.44 4.40 4.26 4.32 4.34
x 4.35 4.79 5.57 5.20 5.07 5.79 5.36 6.40 5.66 5.90 6.49 5.70 6.49 6.37 6.51 7.88 6.74 7.08
The following R output is from a simple linear regression of y on x.
t value
81.283
Estimate
Std. Error
Pr (>It|)
4.858691
(Intercept)
AirVoid
0.059768
<2e-16
-0.074676
0.009923
-7.526
1.21e-06
Residual standard error: 0.03551 on 16 DF Multiple
Adjusted R-squared: 0.76E
p-value: 1.214e-06
R-squared: 0.7797,
F-statistic: 56.63 on 1 and 16 DF,
Analysis of Variance Table
Response: Dielectric
Df
Sum Sq
Mean Sq
F value
Pr (>F)
Airvoid
1
0.071422
0.071422
56.635
1.214e-06
Residuals
16
0.20178
0.001261
Expert Solution
This question has been solved!
Explore an expertly crafted, step-by-step solution for a thorough understanding of key concepts.

This is a popular solution!

Trending now
This is a popular solution!

Step by step
Solved in 2 steps with 2 images

Recommended textbooks for you
Algebra & Trigonometry with Analytic Geometry
Algebra
ISBN:
9781133382119
Author:
Swokowski
Publisher:
Cengage
Algebra & Trigonometry with Analytic Geometry
Algebra
ISBN:
9781133382119
Author:
Swokowski
Publisher:
Cengage