

Q: Determine the following: Price-Quantity variance Cost variance Cost-Quantity variance
A: A) Price quantity variance = ( Units sold in 2021-units sold in 2020)/ Rate per unit of 2020…
Q: for Julu that includor reveDue and spending variances and activity variances. (Indicate
A:
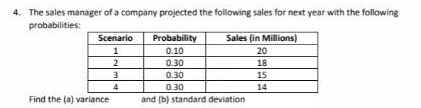
Q: What is the expected return? What is the variance? What is the standard deviation?
A: State Probability Returns Boom 0.25 0.15 Normal 0.50 0.08 Slow down 0.15 0.04…
Q: What is the interpretation of the direct-material quantity variance?
A: Direct material quantity variance is a variance analysis tool for manufacturing companies. It shows…
Q: b) Why are separate price and quantity variances computed?
A: Variances is a word used for finding out the difference between the actual and standard levels set…
Q: TOTAL DM Variance,
A: Standard costing is used to determine the estimated expenses for the production process. In this…
Q: Consider the data scores 8, 9, 13, 20, and 25. Solve for the Range, Mean, Standard Deviation and…
A: The range, mean, standard deviation and variance are the terms used to analyse the nature of the…
Q: The variance and its square root, the standard deviation, are the most commonly used measures of…
A: Variance refers to the expectation of squared deviation of a random value from its arithmetic mean.…
Q: of the following set of terms describes the same type of variance? a)Usage variance, efficiency…
A: The variance is the difference between the actual data and standard output of the production.
Q: Total risk is measured by and systematic risk is measured by Beta; standard deviation. Standard…
A: There are two types of risks systematic risk and unsystematic risk
Q: What is the cost volume variance? * Sample format: 111,111 F or 111,111 U
A: Cost Volume Variance refers to the variance which arises when actual cost of goods sold differs…
Q: The incom
A:
Q: A statistical control chart is best used for determining: A. direct-material price variances. B.…
A: Cost Accounting: It is the process of collecting, recording, analyzing the cost, summarizing cost,…
Q: From the following particulars, calculate the following material variances and give their…
A: Solution:- a)Calculation of Material Cost variance as follows under:- It is difference between the…
Q: ne following:
A: The variances are given as,
Q: Distinguish between a favorable variance and an unfavorable variance.
A: Favorable Variance: Favorable variance is the variation in the actual and planned output which is…
Q: variances
A: Variance means change Variances arise after comparison with standard to Actual. Types of Variances…
Q: Write down two possible causes for each variance.
A: Variance refers to the differs between the budgeted and actual. It may be favourable and…
Q: According to mean-variance rule A. The expected return of X is at least equal to the expected return…
A: As per Mean Variance Rule, For same level of return, investor choose one with lower variance and for…
Q: What is favorable variance? Give three examples?
A: Favorable Variance: Favorable variance is the variation in the actual and planned output which is…
Q: sider the following two sets of data: A = [0.5, -0.6, 0.1, 10] & B = [6, 4, 4.5, 5.5]. Which data…
A: Variance is a measure of risk in finance terms. Variance measures degree of spread for a given data.
Q: Thomas' direct-labor rate variance was:
A: Direct Labor rate Variance is the Variance for the difference between Actual rate and Standard Rate…
Q: Which of the following set of terms describes the same type of variance? Price variance, rate…
A: The variance is calculated as difference between the actual results and standard output.
Q: What are the variances in a 4-variance analysis?
A: Variable overhead spending variance Variable overhead efficiency variance Fixed overhead spending…
Q: Compute for the Standard Deviation:
A: Standard deviation is the variation in returns from the mean value. Standard deviation SD =…
Q: Define unfavourable variance.
A: Variance: Variance refers to the difference level in the actual cost incurred and standard cost. The…
Q: The sales price factor shows a variance of * D
A: Variance caused by selling price in total sales is known as sales price Variance. Formula: Sales…
Q: Pick out the two most significant variances that you computed in (1) above. Explain tMs. Dunn…
A: The difference between the standard figures and the actual results are called variances.
Q: unfavorable variances result from
A: Unfavorable variance:-It is a result of lower sales, higher expenses, or combination when actual…
Q: What is unfavorable variance? Give three examples?
A: Unfavorable Variance: Unfavorable variance is the variation in the actual and planned output which…
Q: is direct material variance a measure of?
A: Direct material variance is the difference between standard material costs and actual material costs…
Q: B. Given the possible causes of the variances, identify the variance for each number and whether…
A: Identifying the names of variances and whether they are favourable or unfavourable is shown…
Q: re all variances investigated? Why or why not?
A: Variance: A variance reflects the degree by which the actual results vary from the anticipated or…
Q: How can we determine the mean and variance of the NPW on the basis of the three NPW estimates?
A: Identify the Rate, project life. Then Identify the cash flows. Compute the Present worth and net…
Q: a. Break down the material cost variance into different related variances: price variance, usage…
A: Variance analysis: It is the technique in budgeting that allows for analysis of the variances…
Q: In performing Variance Analysis for Direct Material costs, the variances include Price and Rate…
A: While performing Variance analysis for Direct Material Costs include Direct Material Price Variance…
Q: Required: Use the variance formulas to compute the following variances. (Indicate the effect of each…
A: Variable-overhead spending variance $54,000 U Variable-overhead efficiency variance $42,000 U…
Q: Which of the following is FALSE regarding variances? O A favorable variance, when it occurred, are…
A: Standard costing refers to the method of costing used to find out the variances. Standard overhead…
Q: Compute for the returns, average of returns and Standard Deviation:
A: Returns Xi is the holding period return for stock prices. Xi= P1/P0 -1 Mean Xbar = ∑Xi/n Standard…

Step by step
Solved in 3 steps with 2 images

- Expected Return, Variance, Std. Deviation and Cofficient of Variation:Magee Inc.'s manager believes that economic conditions during the next year will be strong, normal, or weak, and she thinks that the firm's returns will have the probability distribution shown below. What's the standard deviation of the estimated returns?Round your answer to two decimal places. For example, if your answer is $345.6671 round as 345.67 and if your answer is .05718 or 5.7182% round as 5.72. State of the Economy Probability of State Occurring Stock's Expected Return Boom 20% 24.15% Normal 50% 13.50% Recession 30% –13.30% Group of answer choices 15.68% 16.39% 14.26% 13.54% 10.69%Expected Return, Variance, Std. Deviation and Cofficient of Variation:Magee Inc.'s manager believes that economic conditions during the next year will be strong, normal, or weak, and she thinks that the firm's returns will have the probability distribution shown below. What's the standard deviation of the estimated returns?Round your answer to two decimal places. For example, if your answer is $345.6671 round as 345.67 and if your answer is .05718 or 5.7182% round as 5.72. State of the Economy Probability of State Occurring Stock's Expected Return Boom 20% 22.20% Normal 50% 12.90% Recession 30% –11.40%Expected Return, Variance, Std. Deviation and Cofficient of Variation:Magee Inc.'s manager believes that economic conditions during the next year will be strong, normal, or weak, and she thinks that the firm's returns will have the probability distribution shown below. What's the standard deviation of the estimated returns?Round your answer to two decimal places. For example, if your answer is $345.6671 round as 345.67 and if your answer is .05718 or 5.7182% round as 5.72. State of the Economy Probability of State Occurring Stock's Expected Return Boom 30% 21.60% Normal 55% 13.50% Recession 15% –11.35% A. 11.04% B. 12.10% C. 9.47% D. 10.52% E. 9.99%
- Your rate of retum expectations for the common stock of Company during the next year are: Possible Rate of Return Probability- 0.10 0.250.00 0.150.10 0.350.25 0.25 Required: Compute the expected return [E(R)] on this investment, the variance of this returm, and its standard deviationYour rate of return expectations for the stock of Kayleigh Cosmetics Company during the next year are: KAYLEIGH COSMETICS CO. Possible Rate of Return Probability −0.60 ............0.15 −0.30 ............0.10 −0.10 ............0.05 0.20 ............0.40 0.40 ............0.20 0.80 ............0.10 a. Compute the expected return [E(Ri)] on this stock, the variance (σ2) of this return, and its standard deviation (σ).Use the table for the question(s) below. Consider the following probability distribution of returns for Alpha Corporation: Current Stock Price ($) Stock Price in One Year ($) Return R Probability PR $35 40% 25% $25 $25 0% 50% $20 -20% 25% The variance of the return on Alpha Corporation is closest to: Question content area bottom Part 1 A. 3.75% B. 3.625% C. 4.75% D. 5.00%
- Suppose financial analysts believe that there are four equally likely states of the economy: depression, recession, normal, and boom. The returns on the Supertech Company are expected to follow the economy closely, while the returns on the Slowpoke Company are not. The return predictions are as follows: States of the economy Depression -20% 5% Recession 10% 20% Normal 30% -12% Boom 50% 9% •Required: 1.For each company calculate: i.the expected returns ii.the Variance iii.the Standard deviation 2.For each company calculate and explain: i.The covariance ii.The correlation 3.Assuming you are an investor with GHS100 available. If you invest GHS60 and GHS40 in Allos Inc. and Orangus Inc. respectively, what will be your portfolio returns? 4.Calculate the Standard deviation of the portfolio.Suppose financial analysts believe that there are four equally likely states of the economy: depression, recession, normal, and boom. The returns on the Supertech Company are expected to follow the economy closely, while the returns on the Slowpoke Company are not. The return predictions are as follows: States of the economy Allos Inc. Returns (RA) Orange Inc. Returns (RB) Depression -20% 5% Recession 10% 20% Normal 30% -12% Boom 50% 9% Required: 1.For each company calculate: i.the expected returns ii.the Variance iii.the Standard deviation 2.For each company calculate and explain: i.The covariance ii.The correlation 3.Assuming you are an investor with GHS100 available. If you invest GHS60 and GHS40 in Allos Inc. and Orangus Inc. respectively, what will be your portfolio returns? 4.Calculate the Standard deviation of the portfolio.Consider the following information regarding a new investment that a company intends to undertake:. State of the Economy Probability Market Return Investment Return Expansion 0.30 40% 60% Normal 0.50 10% 25% Recession 0.20 -15% -40% a). Compute the variance and standard deviation of each
- Variance and standard deviation (expected). Hull Consultants, a famous think tank in the Midwest, has provided probability estimates for the four potential economic states for the coming year. The probability of a boom economy is 13%, the probability of a stable growth economy is 17%, the probability of a stagnant economy is 55%, and the probability of a recession is 15%. Calculate the variance and the standard deviation of the three investments: stock, corporate bond, and government bond. If the estimates for both the probabilities of the economy and the returns in each state of the economy are correct, which investment would you choose, considering both risk and return? Investment Forecasted Returns for Each Economy Boom Stable Growth Stagnant Recession Stock 25% 12% 7% −10% Corporate bond 9% 7% 5% 3% Government bond 8% 6% 4%…It is November 2019. The following variance -covariance matrix, for the market (S&P 500) and stocks T and U, is based on monthly data from November 2014 to October 2019. Assume T and U are included in the S&P 500. The betas for T and U are T = 0.727 and U = 0.75. S&P500 T U S&P500 0.0256 0.0186 0.0192 T 0.0186 0.1225 0.0262 U 0.0192 0.0262 0.0900 Average monthly risk premiums from 2014 to 2019 were: S&P500 : 1.0% T : 0.6% U : 1.1% Assume the CAPM is correct, and tge expected future market risk premium is 0.6% per month. The risk free interest rate is 0.3% per month. Required: What were the alpha's for stock T and U over the last 60 months?Stock A has the following returns over the past periods. Calculate the downside risk measured by semi-variance? (answer with 4 decimal spaces) 0.0057 -0.0255 0.0621 -0.0879 -0.0983 0.0813 0.0356 -0.0015 -0.0307 0.0427 0.0297 0.0192

