d. Develop the estimated regression equation by computing the values of bo and b₁ using equations: (Enter negative values as negative figure) Σ(xi-T) (Yi - T) Σ(Xi − T)² b₁ = bo = ý – bí ŷ = (to 2 decimals) e. Use the estimated regression equation to predict the value of y when x = 6. y = * (to 2 decimals) *+
d. Develop the estimated regression equation by computing the values of bo and b₁ using equations: (Enter negative values as negative figure) Σ(xi-T) (Yi - T) Σ(Xi − T)² b₁ = bo = ý – bí ŷ = (to 2 decimals) e. Use the estimated regression equation to predict the value of y when x = 6. y = * (to 2 decimals) *+

Glencoe Algebra 1, Student Edition, 9780079039897, 0079039898, 2018
18th Edition
ISBN:9780079039897
Author:Carter
Publisher:Carter
Chapter10: Statistics
Section10.5: Comparing Sets Of Data
Problem 14PPS

Related questions
Question
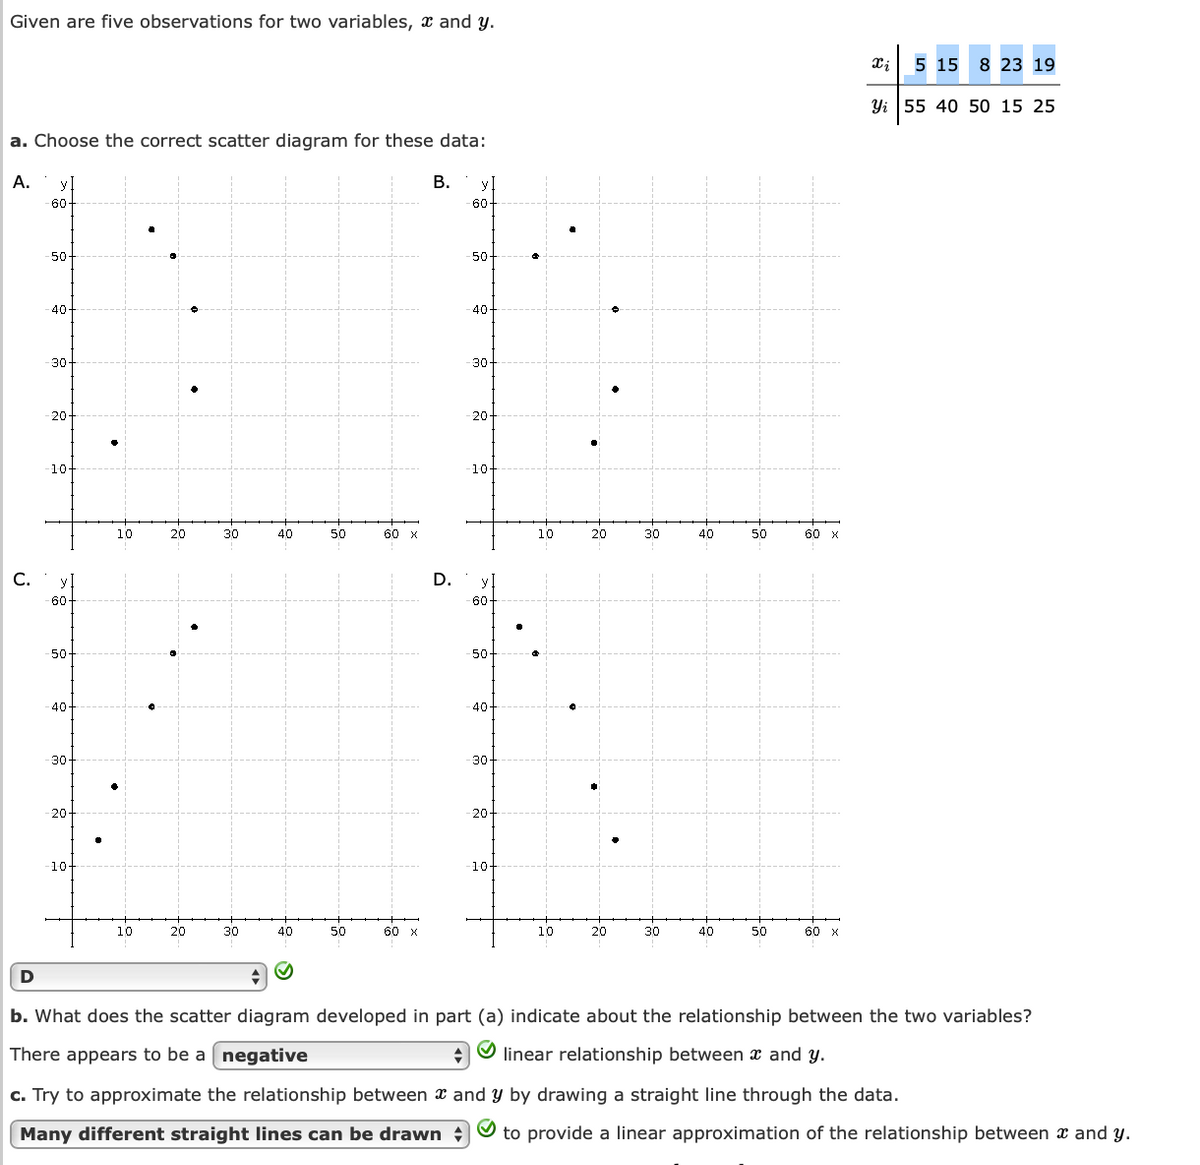
Transcribed Image Text:Given are five observations for two variables, and y.
a. Choose the correct scatter diagram for these data:
A.
C.
D
60
50
40
30-
20
-10-
60
50
40
-30
20
10-
10
10
20
20
30
30
40
40
50
50
60 x
60 x
B.
D.
60
50
40
30
20
10-
60
50
40
30-
20
10-
10
10
20
20
30
30
40
40
50
50
60 x
60 x
5 15 8 23 19
Xi
Yi 55 40 50 15 25
b. What does the scatter diagram developed in part (a) indicate about the relationship between the two variables?
There appears to be a negative
linear relationship between x and y.
and y by drawing a straight line through the data.
c. Try to approximate the relationship between
Many different straight lines can be drawn
✔ to provide a linear approximation of the relationship between x and y.
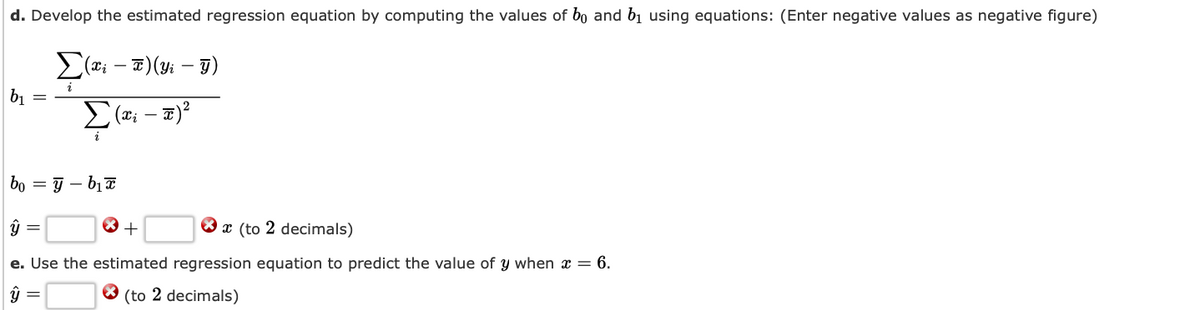
Transcribed Image Text:d. Develop the estimated regression equation by computing the values of bo and b₁ using equations: (Enter negative values as negative figure)
(x₁ - x)(y₁ - y)
Σ(x₁ - x)²
b₁
bo =y-b₁x
ÿ
* +
x (to 2 decimals)
e. Use the estimated regression equation to predict the value of y when x = 6.
X (to 2 decimals)
Expert Solution
This question has been solved!
Explore an expertly crafted, step-by-step solution for a thorough understanding of key concepts.

This is a popular solution!

Trending now
This is a popular solution!

Step by step
Solved in 2 steps with 2 images

Recommended textbooks for you
Glencoe Algebra 1, Student Edition, 9780079039897…
Algebra
ISBN:
9780079039897
Author:
Carter
Publisher:
McGraw Hill
Glencoe Algebra 1, Student Edition, 9780079039897…
Algebra
ISBN:
9780079039897
Author:
Carter
Publisher:
McGraw Hill