d. ²: e. Interpret ²: O 73% of all students will receive the average score on the final exam. (Round to two decimal places) O Given any group that spends a fixed amount of time studying per week, 73% of all of those students will receive the predicted score on the final exam. O There is a 73% chance that the regression line will be a good predictor for the final exam score based on the time spent studying. O There is a large variation in the final exam scores that students receive, but if you only look at students who spend a fixed amount of time studying per week, this variation on average is reduced by 73%. f. The equation of the linear regression line is: ŷ= (Please show your answers to two decimal places)
d. ²: e. Interpret ²: O 73% of all students will receive the average score on the final exam. (Round to two decimal places) O Given any group that spends a fixed amount of time studying per week, 73% of all of those students will receive the predicted score on the final exam. O There is a 73% chance that the regression line will be a good predictor for the final exam score based on the time spent studying. O There is a large variation in the final exam scores that students receive, but if you only look at students who spend a fixed amount of time studying per week, this variation on average is reduced by 73%. f. The equation of the linear regression line is: ŷ= (Please show your answers to two decimal places)

Glencoe Algebra 1, Student Edition, 9780079039897, 0079039898, 2018
18th Edition
ISBN:9780079039897
Author:Carter
Publisher:Carter
Chapter4: Equations Of Linear Functions
Section4.5: Correlation And Causation
Problem 2CYU

Related questions
Question
100%
Question 33 - please solve letter D-I
Transcribed Image Text:Question 33
☐
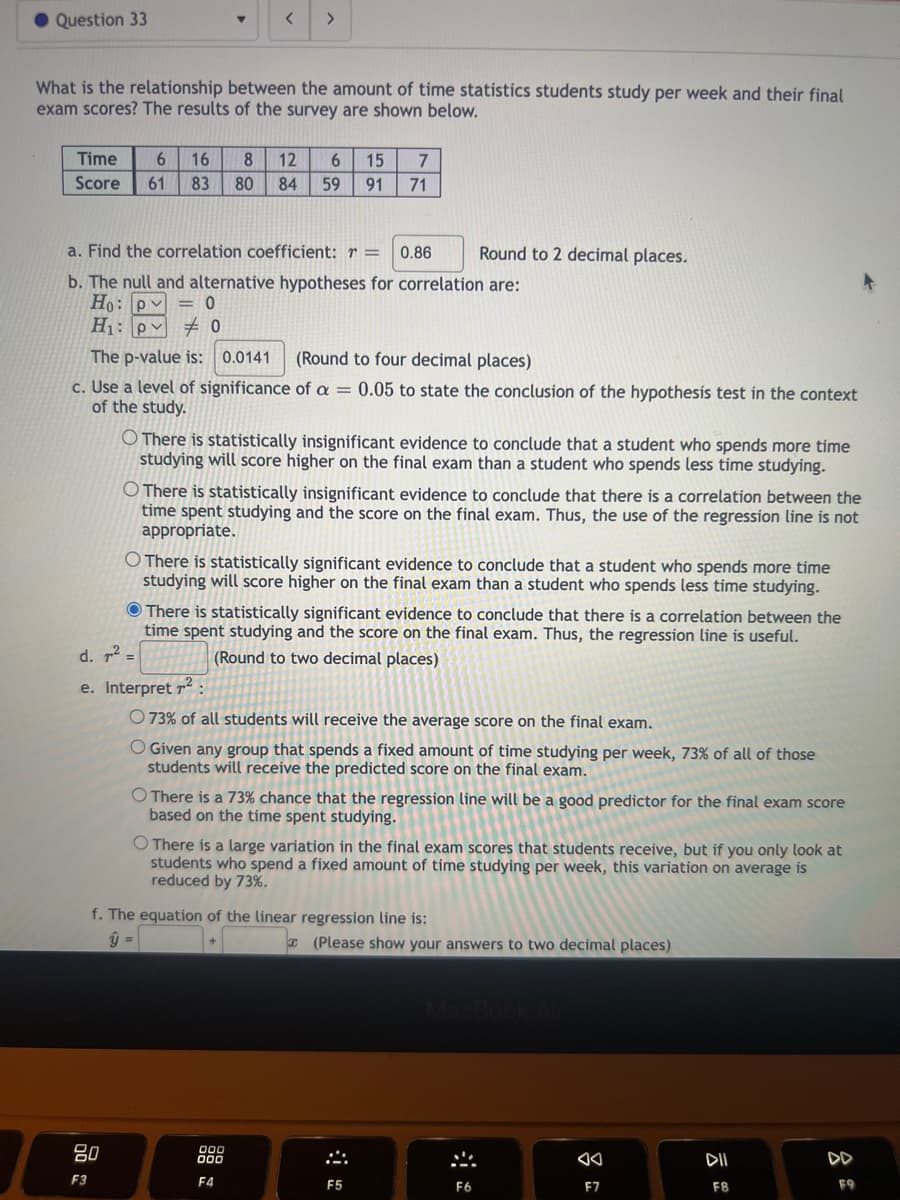
What is the relationship between the amount of time statistics students study per week and their final
exam scores? The results of the survey are shown below.
V
< >
Time 6 16 8 12 6 15 7
Score 61 83 80 84 59 91
71
a. Find the correlation coefficient: r = 0.86
b. The null and alternative hypotheses for correlation are:
Ho: pv = 0
H₁: p0
The p-value is: 0.0141 (Round to four decimal places)
c. Use a level of significance of a = 0.05 to state the conclusion of the hypothesis test in the context
of the study.
80
F3
O There is statistically insignificant evidence to conclude that a student who spends more time
studying will score higher on the fin exam than a student who spends less time studying.
There is statistically insignificant evidence to conclude that there is a correlation between the
time spent studying and the score on the final exam. Thus, the use of the regression line is not
appropriate.
O There is statistically significant evidence to conclude that a student who spends more time
studying will score higher on the final exam than a student who spends less time studying.
There is statistically significant evidence to conclude that there is a correlation between the
time spent studying and the score on the final exam. Thus, the regression line is useful.
d. ² =
(Round to two decimal places)
Round to 2 decimal places.
e. Interpret 7².
O 73% of all students will receive the average score on the final exam.
O Given any group that spends a fixed amount of time studying per week, 73% of all of those
students will receive the predicted score on the final exam.
O There is a 73% chance that the regression line will be a good predictor for the final exam score
based on the time spent studying.
f. The equation of the linear regression line is:
ŷ =
000
900
F4
O There is a large variation in the final exam scores that students receive, but if you only look at
students who spend a fixed amount of time studying per week, this variation on average is
reduced by 73%.
(Please show your answers to two decimal places)
..
F5
F6
◄◄
F7
DII
F8
DD
F9
![#
e. Interpret ²:
O 73% of all students will receive the average score on the final exam.
O Given any group that spends a fixed amount of time studying per week, 73% of all of those
students will receive the predicted score on the final exam.
O There is a 73% chance that the regression line will be a good predictor for the final exam score
based on the time spent studying.
O There is a large variation in the final exam scores that students receive, but if you only look at
students who spend a fixed amount of time studying per week, this variation on average is
reduced by 73%.
f. The equation of the linear regression line is:
+
(Please show your answers to two decimal places)
g. Use the model to predict the final exam score for a student who spends 6 hours per week studying.
Final exam score =
(Please round your answer to the nearest whole number.)
h. Interpret the slope of the regression line in the context of the question:
80
F3
O As x goes up, y goes up.
O The slope has no practical meaning since you cannot predict what any individual student will
score on the final.
O For every additional hour per week students spend studying, they tend to score on averge 2.44
higher on the final exam.
i. Interpret the y-intercept in the context of the question:
O If a student does not study at all, then that student will score 51 on the final exam.
The best prediction for a student who doesn't study at all is that the student will score 51 on
the final exam.
O The y-intercept has no practical meaning for this study.
O The average final exam score is predicted to be 51.
Hint: Helpful Video on the Linear Regression Line [+]
Helpful Video on Correlation
[+]
Helpful Video on Hypothesis Tests for Correlation
Hints
[+]
Submit Question
SA
F4
do
%
F5
<
F6
&
F7
DII
F8
DD
F9](/v2/_next/image?url=https%3A%2F%2Fcontent.bartleby.com%2Fqna-images%2Fquestion%2Fa3f191a8-a1b2-42ed-ac9e-32d60645d728%2Fb973938b-9663-4d46-aa29-ce021aa60679%2Fm94i0yh_processed.jpeg&w=3840&q=75)
Transcribed Image Text:#
e. Interpret ²:
O 73% of all students will receive the average score on the final exam.
O Given any group that spends a fixed amount of time studying per week, 73% of all of those
students will receive the predicted score on the final exam.
O There is a 73% chance that the regression line will be a good predictor for the final exam score
based on the time spent studying.
O There is a large variation in the final exam scores that students receive, but if you only look at
students who spend a fixed amount of time studying per week, this variation on average is
reduced by 73%.
f. The equation of the linear regression line is:
+
(Please show your answers to two decimal places)
g. Use the model to predict the final exam score for a student who spends 6 hours per week studying.
Final exam score =
(Please round your answer to the nearest whole number.)
h. Interpret the slope of the regression line in the context of the question:
80
F3
O As x goes up, y goes up.
O The slope has no practical meaning since you cannot predict what any individual student will
score on the final.
O For every additional hour per week students spend studying, they tend to score on averge 2.44
higher on the final exam.
i. Interpret the y-intercept in the context of the question:
O If a student does not study at all, then that student will score 51 on the final exam.
The best prediction for a student who doesn't study at all is that the student will score 51 on
the final exam.
O The y-intercept has no practical meaning for this study.
O The average final exam score is predicted to be 51.
Hint: Helpful Video on the Linear Regression Line [+]
Helpful Video on Correlation
[+]
Helpful Video on Hypothesis Tests for Correlation
Hints
[+]
Submit Question
SA
F4
do
%
F5
<
F6
&
F7
DII
F8
DD
F9
Expert Solution
This question has been solved!
Explore an expertly crafted, step-by-step solution for a thorough understanding of key concepts.

Step by step
Solved in 4 steps with 4 images

Recommended textbooks for you
Glencoe Algebra 1, Student Edition, 9780079039897…
Algebra
ISBN:
9780079039897
Author:
Carter
Publisher:
McGraw Hill
Glencoe Algebra 1, Student Edition, 9780079039897…
Algebra
ISBN:
9780079039897
Author:
Carter
Publisher:
McGraw Hill