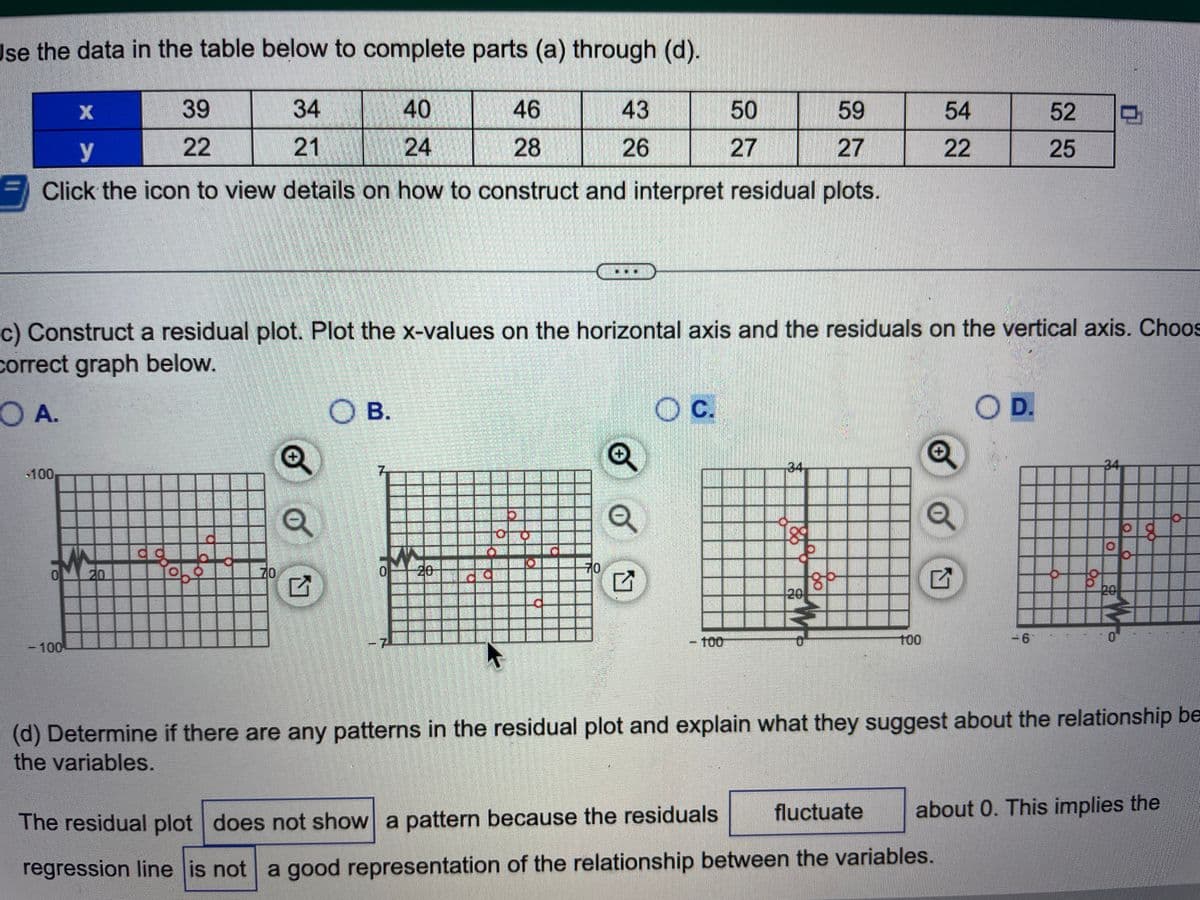
se the data in the table below to complete parts (a) through (d). -100 <-100 39 22 do g 34 21 X y Click the icon to view details on how to construct and interpret residual plots. O 40 24 K7 46 28 OB. 43 =) Construct a residual plot. Plot the x-values on the horizontal axis and the residuals on the vertical axis. Chc Orrect graph below. DA. 26 .... 50 27 C. -100 59 27 18p 100 54 22 Q 52 25 fluctuate The residual plot does not show a pattern because the residuals regression line is not a good representation of the relationship between the variables. O O a O (d) Determine if there are any patterns in the residual plot and explain what they suggest about the relationship the variables. about 0. This implies the
se the data in the table below to complete parts (a) through (d). -100 <-100 39 22 do g 34 21 X y Click the icon to view details on how to construct and interpret residual plots. O 40 24 K7 46 28 OB. 43 =) Construct a residual plot. Plot the x-values on the horizontal axis and the residuals on the vertical axis. Chc Orrect graph below. DA. 26 .... 50 27 C. -100 59 27 18p 100 54 22 Q 52 25 fluctuate The residual plot does not show a pattern because the residuals regression line is not a good representation of the relationship between the variables. O O a O (d) Determine if there are any patterns in the residual plot and explain what they suggest about the relationship the variables. about 0. This implies the

Glencoe Algebra 1, Student Edition, 9780079039897, 0079039898, 2018
18th Edition
ISBN:9780079039897
Author:Carter
Publisher:Carter
Chapter4: Equations Of Linear Functions
Section4.6: Regression And Median-fit Lines
Problem 2CYU

Related questions
Question
100%
Construct a residual plot.
Transcribed Image Text:Use the data in the table below to complete parts (a) through (d).
59
27
y
Click the icon to view details on how to construct and interpret residual plots.
$100
0
-100
39
22
20
34
21
70
Q
G
40
24
c) Construct a residual plot. Plot the x-values on the horizontal axis and the residuals on the vertical axis. Choos
correct graph below.
O A.
OB.
46
28
0
C
43
26
70
Q
Q
OC.
50
27
- 100
34
89
20
00
100
54
22
Q
G
D.
fluctuate
The residual plot does not show a pattern because the residuals
regression line is not a good representation of the relationship between the variables.
52
25
-6
34
0
20
og
(d) Determine if there are any patterns in the residual plot and explain what they suggest about the relationship be
the variables.
about 0. This implies the
o
Expert Solution
This question has been solved!
Explore an expertly crafted, step-by-step solution for a thorough understanding of key concepts.

This is a popular solution!

Trending now
This is a popular solution!

Step by step
Solved in 2 steps with 2 images

Recommended textbooks for you
Glencoe Algebra 1, Student Edition, 9780079039897…
Algebra
ISBN:
9780079039897
Author:
Carter
Publisher:
McGraw Hill

Big Ideas Math A Bridge To Success Algebra 1: Stu…
Algebra
ISBN:
9781680331141
Author:
HOUGHTON MIFFLIN HARCOURT
Publisher:
Houghton Mifflin Harcourt

Holt Mcdougal Larson Pre-algebra: Student Edition…
Algebra
ISBN:
9780547587776
Author:
HOLT MCDOUGAL
Publisher:
HOLT MCDOUGAL
Glencoe Algebra 1, Student Edition, 9780079039897…
Algebra
ISBN:
9780079039897
Author:
Carter
Publisher:
McGraw Hill
Big Ideas Math A Bridge To Success Algebra 1: Stu…
Algebra
ISBN:
9781680331141
Author:
HOUGHTON MIFFLIN HARCOURT
Publisher:
Houghton Mifflin Harcourt
Holt Mcdougal Larson Pre-algebra: Student Edition…
Algebra
ISBN:
9780547587776
Author:
HOLT MCDOUGAL
Publisher:
HOLT MCDOUGAL