D. Starting with day 2 and going through day 20, Greg created a graph to show the between the day and the total number of quarters he had saved by the end of the Greg plotted each of the 19 data points and then connected them. Describe wha Greg's graph looked like.
D. Starting with day 2 and going through day 20, Greg created a graph to show the between the day and the total number of quarters he had saved by the end of the Greg plotted each of the 19 data points and then connected them. Describe wha Greg's graph looked like.

Chapter2: Solving Linear Equations
Section2.4: Solve Mixture And Uniform Motion Applications
Problem 291E: Sarah wants to arrive at her friend’s wedding at 3:00. The distance from Sarah’s house to the...

Related questions
Question
Please help I’m very desperate thank you so much. 61
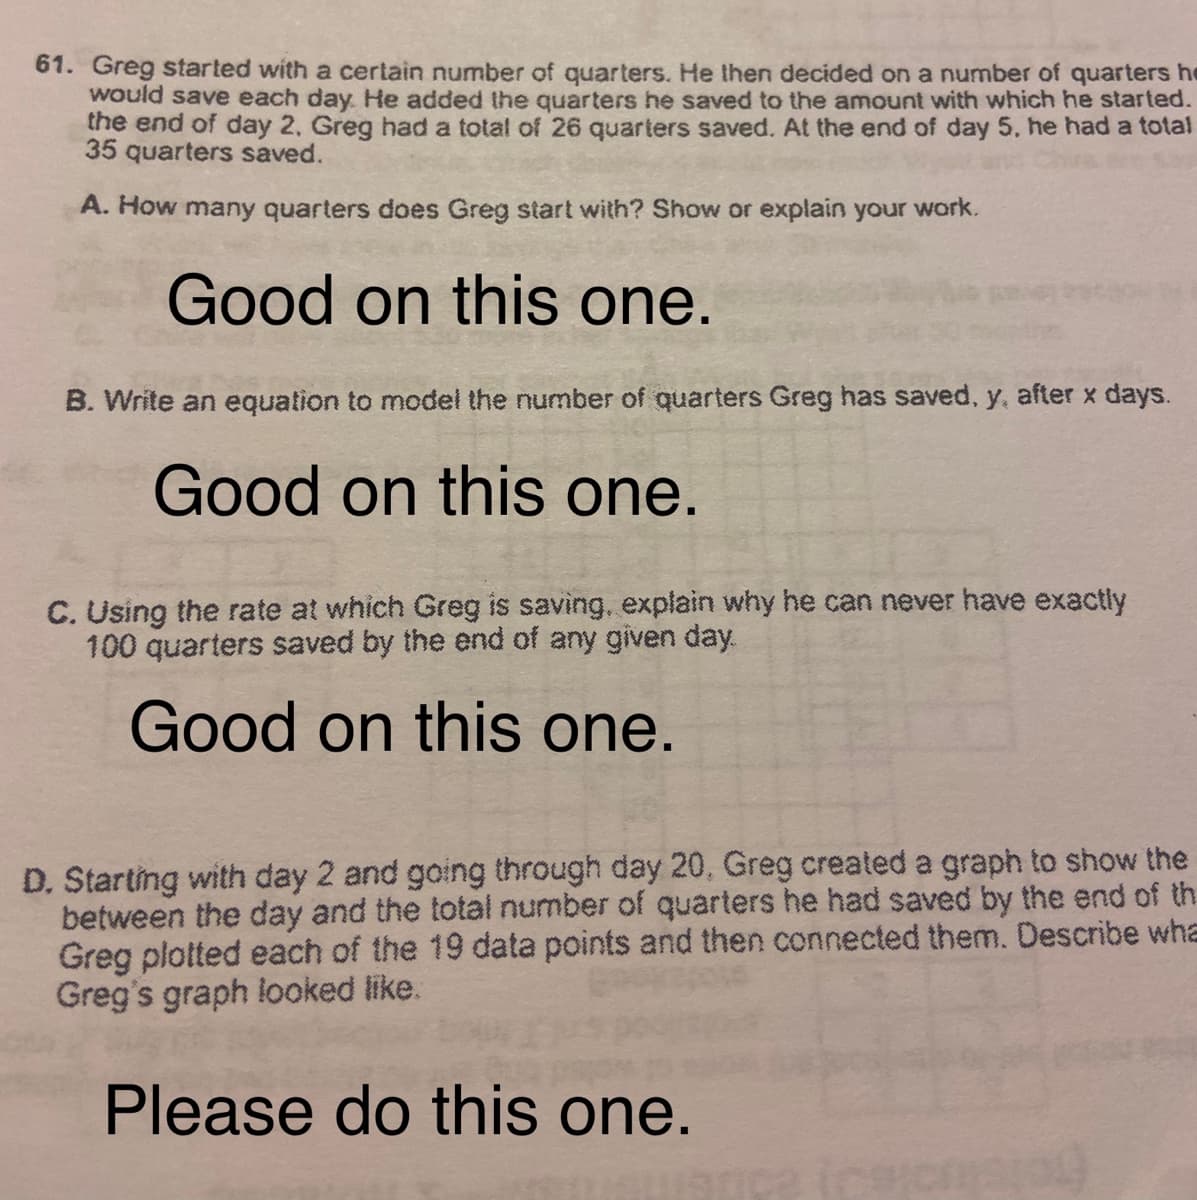
Transcribed Image Text:61. Greg started with a certain number of quarters. He then decided on a number of quarters he
would save each day. He added the quarters he saved to the amount with which he started.
the end of day 2, Greg had a total of 26 quarters saved. At the end of day 5, he had a total
35 quarters saved.
A. How many quarters does Greg start with? Show or explain your work.
Good on this one.
B. Write an equation to model the number of quarters Greg has saved, y, after x days.
Good on this one.
C. Using the rate at which Greg is saving, explain why he can never have exactly
100 quarters saved by the end of any given day.
Good on this one.
D. Starting with day 2 and going through day 20, Greg created a graph to show the
between the day and the total number of quarters he had saved by the end of th
Greg plotted each of the 19 data points and then connected them. Describe wha
Greg's graph looked like.
Please do this one.
Expert Solution
This question has been solved!
Explore an expertly crafted, step-by-step solution for a thorough understanding of key concepts.

This is a popular solution!

Trending now
This is a popular solution!

Step by step
Solved in 3 steps with 1 images

Knowledge Booster


Learn more about
Need a deep-dive on the concept behind this application? Look no further. Learn more about this topic, algebra and related others by exploring similar questions and additional content below.Recommended textbooks for you


Glencoe Algebra 1, Student Edition, 9780079039897…
Algebra
ISBN:
9780079039897
Author:
Carter
Publisher:
McGraw Hill
Glencoe Algebra 1, Student Edition, 9780079039897…
Algebra
ISBN:
9780079039897
Author:
Carter
Publisher:
McGraw Hill

Holt Mcdougal Larson Pre-algebra: Student Edition…
Algebra
ISBN:
9780547587776
Author:
HOLT MCDOUGAL
Publisher:
HOLT MCDOUGAL

Algebra: Structure And Method, Book 1
Algebra
ISBN:
9780395977224
Author:
Richard G. Brown, Mary P. Dolciani, Robert H. Sorgenfrey, William L. Cole
Publisher:
McDougal Littell

Elementary Algebra
Algebra
ISBN:
9780998625713
Author:
Lynn Marecek, MaryAnne Anthony-Smith
Publisher:
OpenStax - Rice University