If a Bar graph is drawn with the data as per the list given below then the minimum height of the graph would be Section: Accounts Marketing Purchase Stores Production No. of Workers: 14 20 64 28 17 O 19 64 O 14 O 128 O 20
If a Bar graph is drawn with the data as per the list given below then the minimum height of the graph would be Section: Accounts Marketing Purchase Stores Production No. of Workers: 14 20 64 28 17 O 19 64 O 14 O 128 O 20

College Algebra (MindTap Course List)
12th Edition
ISBN:9781305652231
Author:R. David Gustafson, Jeff Hughes
Publisher:R. David Gustafson, Jeff Hughes
Chapter5: Exponential And Logarithmic Functions
Section5.3: Logarithmic Functions And Their Graphs
Problem 137E

Related questions

Question
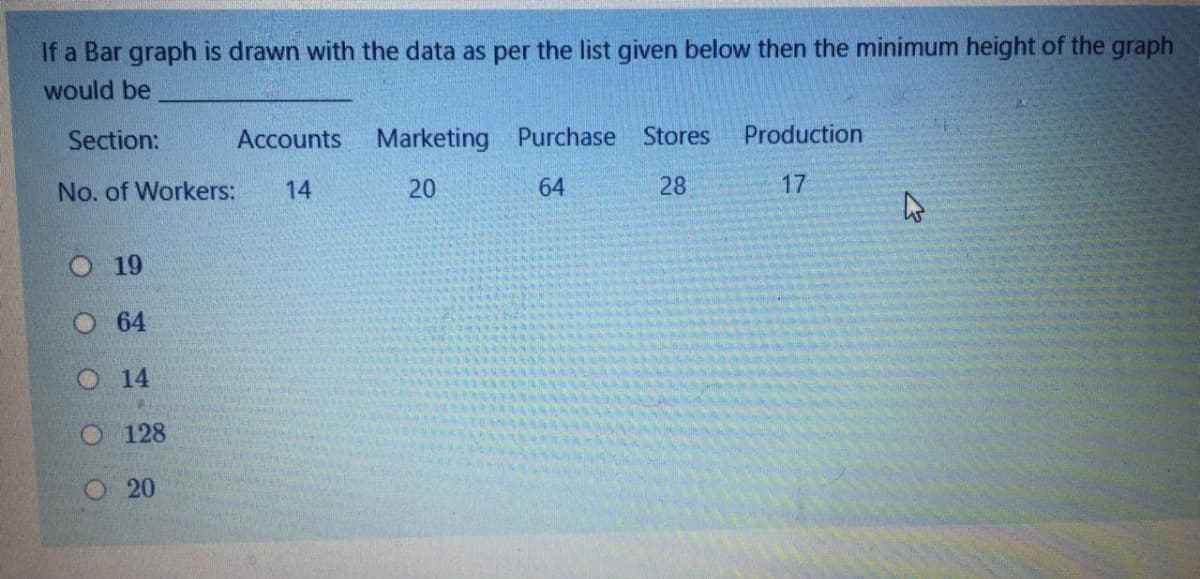
Transcribed Image Text:If a Bar graph is drawn with the data as per the list given below then the minimum height of the graph
would be
Section:
Accounts
Marketing Purchase Stores
Production
No. of Workers:
14
20
64
28
17
O19
O 64
O 14
O 128
O 20
Expert Solution
This question has been solved!
Explore an expertly crafted, step-by-step solution for a thorough understanding of key concepts.

Step by step
Solved in 2 steps with 2 images

Knowledge Booster


Learn more about
Need a deep-dive on the concept behind this application? Look no further. Learn more about this topic, calculus and related others by exploring similar questions and additional content below.Recommended textbooks for you
College Algebra (MindTap Course List)
Algebra
ISBN:
9781305652231
Author:
R. David Gustafson, Jeff Hughes
Publisher:
Cengage Learning
College Algebra (MindTap Course List)
Algebra
ISBN:
9781305652231
Author:
R. David Gustafson, Jeff Hughes
Publisher:
Cengage Learning