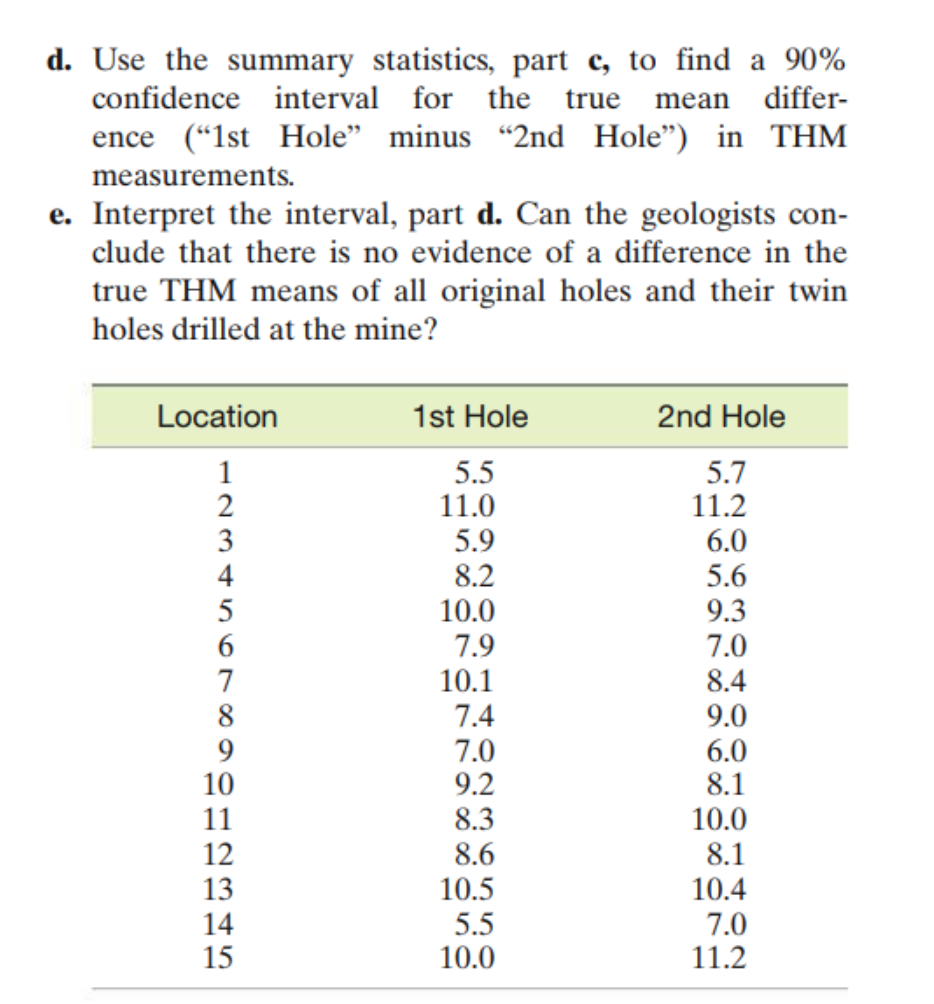
d. Use the summary statistics, part c, to find a 90% confidence interval for the true mean differ- ence (“1st Hole" minus "2nd Hole") in THM measurements. e. Interpret the interval, part d. Can the geologists con- clude that there is no evidence of a difference in the true THM means of all original holes and their twin holes drilled at the mine?
d. Use the summary statistics, part c, to find a 90% confidence interval for the true mean differ- ence (“1st Hole" minus "2nd Hole") in THM measurements. e. Interpret the interval, part d. Can the geologists con- clude that there is no evidence of a difference in the true THM means of all original holes and their twin holes drilled at the mine?

Linear Algebra: A Modern Introduction
4th Edition
ISBN:9781285463247
Author:David Poole
Publisher:David Poole
Chapter4: Eigenvalues And Eigenvectors
Section4.6: Applications And The Perron-frobenius Theorem
Problem 25EQ

Related questions
Question
Transcribed Image Text:d. Use the summary statistics, part c, to find a 90%
confidence interval for the
true
mean
differ-
ence (“Ist Hole" minus "2nd Hole") in THM
measurements.
e. Interpret the interval, part d. Can the geologists con-
clude that there is no evidence of a difference in the
true THM means of all original holes and their twin
holes drilled at the mine?
Location
1st Hole
2nd Hole
1
2
5.5
11.0
5.9
5.7
11.2
6.0
3
4
8.2
5.6
5
10.0
9.3
7.9
10.1
7.0
7
8.4
8
7.4
9.0
9
7.0
9.2
6.0
8.1
10
10.0
8.3
8.6
11
12
8.1
13
10.5
10.4
5.5
10.0
7.0
11.2
14
15
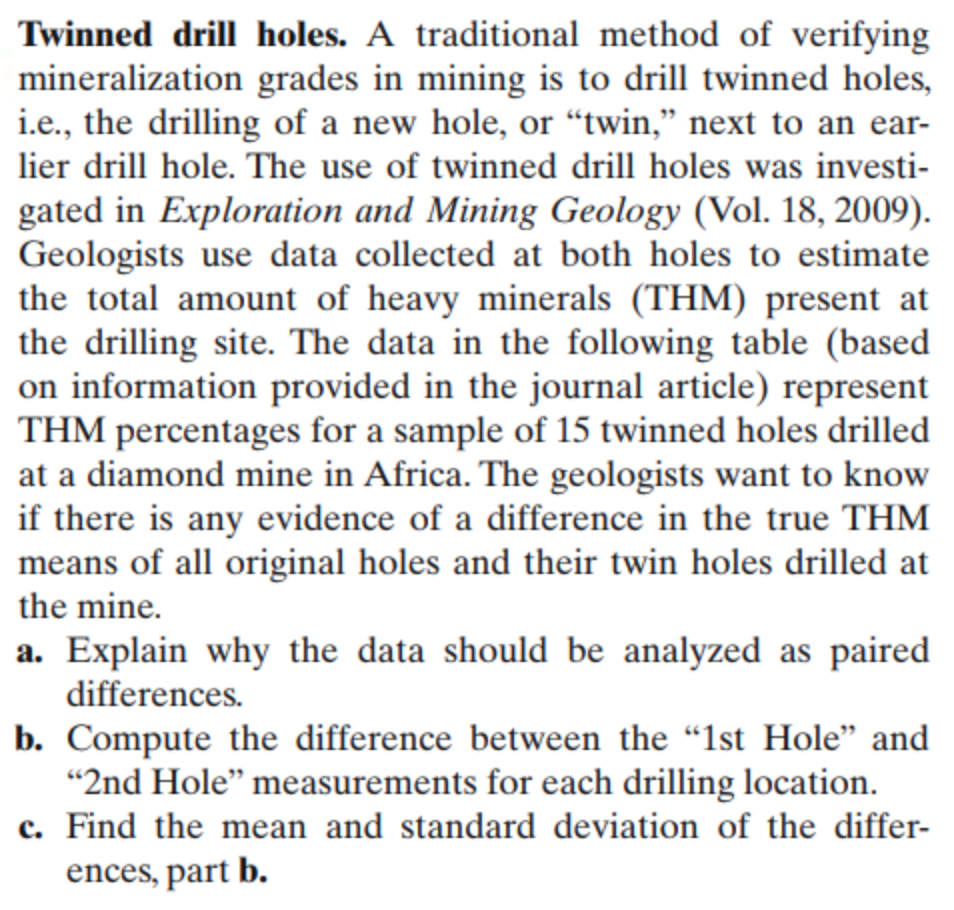
Transcribed Image Text:Twinned drill holes. A traditional method of verifying
mineralization grades in mining is to drill twinned holes,
i.e., the drilling of a new hole, or “twin," next to an ear-
lier drill hole. The use of twinned drill holes was investi-
gated in Exploration and Mining Geology (Vol. 18, 2009).
Geologists use data collected at both holes to estimate
the total amount of heavy minerals (THM) present at
the drilling site. The data in the following table (based
on information provided in the journal article) represent
THM percentages for a sample of 15 twinned holes drilled
at a diamond mine in Africa. The geologists want to know
if there is any evidence of a difference in the true THM
means of all original holes and their twin holes drilled at
the mine.
a. Explain why the data should be analyzed as paired
differences.
b. Compute the difference between the “Ist Hole" and
"2nd Hole" measurements for each drilling location.
c. Find the mean and standard deviation of the differ-
ences, part b.
Expert Solution
This question has been solved!
Explore an expertly crafted, step-by-step solution for a thorough understanding of key concepts.

Step by step
Solved in 4 steps with 1 images

Recommended textbooks for you
Linear Algebra: A Modern Introduction
Algebra
ISBN:
9781285463247
Author:
David Poole
Publisher:
Cengage Learning
Linear Algebra: A Modern Introduction
Algebra
ISBN:
9781285463247
Author:
David Poole
Publisher:
Cengage Learning