s. Calculate the point estimate and confidence interval with a 2.5 mph margin of error.
s. Calculate the point estimate and confidence interval with a 2.5 mph margin of error.

Glencoe Algebra 1, Student Edition, 9780079039897, 0079039898, 2018
18th Edition
ISBN:9780079039897
Author:Carter
Publisher:Carter
Chapter10: Statistics
Section10.3: Measures Of Spread
Problem 1GP

Related questions
Question
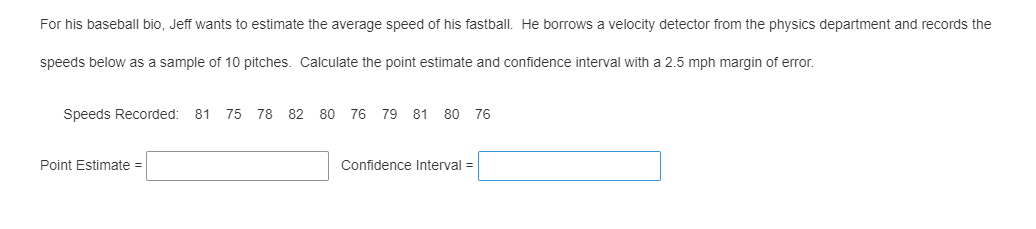
Transcribed Image Text:For his baseball bio, Jeff wants to estimate the average speed of his fastball. He borrows a velocity detector from the physics department and records the
speeds below as a sample of 10 pitches. Calculate the point estimate and confidence interval with a 2.5 mph margin of error.
Speeds Recorded: 81 75 78 82 80 76 79 81 80 76
Point Estimate =
Confidence Interval =
Expert Solution
This question has been solved!
Explore an expertly crafted, step-by-step solution for a thorough understanding of key concepts.

This is a popular solution!

Trending now
This is a popular solution!

Step by step
Solved in 2 steps with 1 images

Recommended textbooks for you
Glencoe Algebra 1, Student Edition, 9780079039897…
Algebra
ISBN:
9780079039897
Author:
Carter
Publisher:
McGraw Hill
Glencoe Algebra 1, Student Edition, 9780079039897…
Algebra
ISBN:
9780079039897
Author:
Carter
Publisher:
McGraw Hill