D. What can you say about any influential observations in the data? Justify your answer numerically.
D. What can you say about any influential observations in the data? Justify your answer numerically.

Glencoe Algebra 1, Student Edition, 9780079039897, 0079039898, 2018
18th Edition
ISBN:9780079039897
Author:Carter
Publisher:Carter
Chapter4: Equations Of Linear Functions
Section4.6: Regression And Median-fit Lines
Problem 4PPS

Related questions
Question
only need D from this I got a,b,c from another question
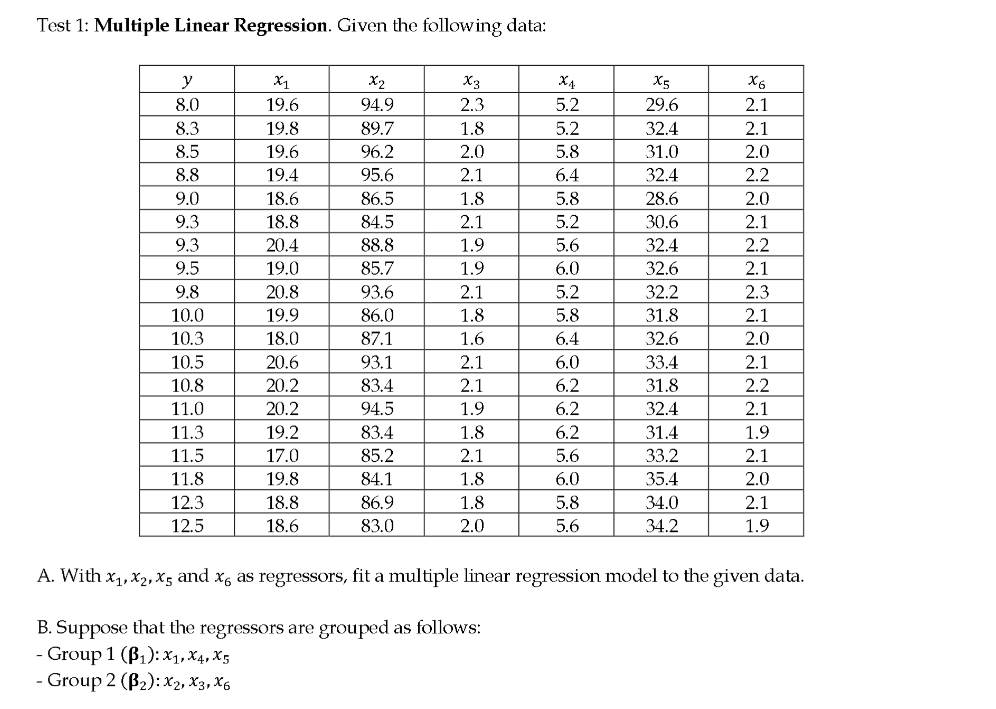
Transcribed Image Text:Test 1: Multiple Linear Regression. Given the following data:
y
x1
X2
X3
X₁
X5
x6
8.0
19.6
94.9
2.3
5.2
29.6
2.1
8.3
19.8
89.7
1.8
5.2
32.4
2.1
8.5
19.6
96.2
2.0
5.8
31.0
2.0
8.8
19.4
95.6
2.1
6.4
32.4
2.2
9.0
18.6
86.5
1.8
5.8
28.6
2.0
9.3
18.8
84.5
2.1
5.2
30.6
2.1
9.3
20.4
88.8
1.9
5.6
32.4
2.2
9.5
19.0
85.7
1.9
6.0
32.6
2.1
9.8
20.8
93.6
2.1
5.2
32.2
2.3
10.0
19.9
86.0
1.8
5.8
31.8
2.1
10.3
18.0
87.1
1.6
6.4
32.6
2.0
10.5
20.6
93.1
2.1
6.0
33.4
2.1
10.8
20.2
83.4
2.1
6.2
31.8
2.2
11.0
20.2
94.5
1.9
6.2
32.4
2.1
11.3
19.2
83.4
1.8
6.2
31.4
1.9
11.5
17.0
85.2
2.1
5.6
33.2
2.1
11.8
19.8
84.1
1.8
6.0
35.4
2.0
12.3
18.8
86.9
1.8
5.8
34.0
2.1
12.5
18.6
83.0
2.0
5.6
34.2
1.9
A. With x₁, x2, x5 and x6 as regressors, fit a multiple linear regression model to the given data.
B. Suppose that the regressors are grouped as follows:
- Group 1 (B₁): x1, X4, X5
- Group 2 (B₂): X2, X3, X6
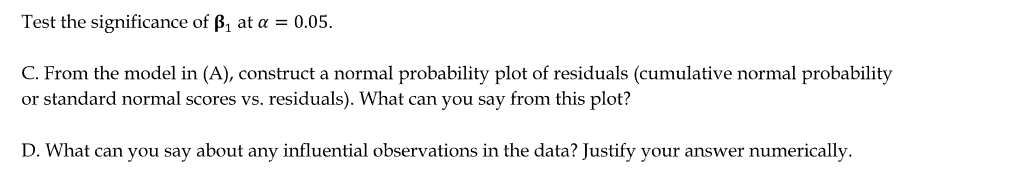
Transcribed Image Text:Test the significance of ß₁ at a = 0.05.
C. From the model in (A), construct a normal probability plot of residuals (cumulative normal probability
or standard normal scores vs. residuals). What can you say from this plot?
D. What can you say about any influential observations in the data? Justify your answer numerically.
Expert Solution
This question has been solved!
Explore an expertly crafted, step-by-step solution for a thorough understanding of key concepts.

Step by step
Solved in 2 steps with 1 images

Recommended textbooks for you
Glencoe Algebra 1, Student Edition, 9780079039897…
Algebra
ISBN:
9780079039897
Author:
Carter
Publisher:
McGraw Hill

Functions and Change: A Modeling Approach to Coll…
Algebra
ISBN:
9781337111348
Author:
Bruce Crauder, Benny Evans, Alan Noell
Publisher:
Cengage Learning

Glencoe Algebra 1, Student Edition, 9780079039897…
Algebra
ISBN:
9780079039897
Author:
Carter
Publisher:
McGraw Hill
Functions and Change: A Modeling Approach to Coll…
Algebra
ISBN:
9781337111348
Author:
Bruce Crauder, Benny Evans, Alan Noell
Publisher:
Cengage Learning