داد *** 9m 10 21 17 13 28 5 20 r- : 7 7 $ 25 USE SALT . 2 = 2500 2 = 99 22 - 4,948 12 - 763: Ey = 1,882 (a) Find y. b. and the equation of the least-squares line. (Round your answers for and y to two decimal places. Round your least-squares estimates to three decimal places) .. O 15 10 (b) Draw a scatter diagram for the data. Plot the least-squares line on your scatter diagram. 10 3 " 22 3 13 20 25 3 10 15 20 25 30 میرا با خدا What percentage of variation 15 29. 10 10 bre تر 16 3 10 20 23 ار (c) Find the sample correlation coefficient and the coefficient of determination. (Round your answers to three decimal places.) r 10 15 20 25 30 of variation in y is explained by the least-squares model? (Round your answer to one decimal place.) (d) In a week during which Dorothy makes 23 visits, how many people do you predict will buy insurance from her? (Round your answer to one decimal place.) people
داد *** 9m 10 21 17 13 28 5 20 r- : 7 7 $ 25 USE SALT . 2 = 2500 2 = 99 22 - 4,948 12 - 763: Ey = 1,882 (a) Find y. b. and the equation of the least-squares line. (Round your answers for and y to two decimal places. Round your least-squares estimates to three decimal places) .. O 15 10 (b) Draw a scatter diagram for the data. Plot the least-squares line on your scatter diagram. 10 3 " 22 3 13 20 25 3 10 15 20 25 30 میرا با خدا What percentage of variation 15 29. 10 10 bre تر 16 3 10 20 23 ار (c) Find the sample correlation coefficient and the coefficient of determination. (Round your answers to three decimal places.) r 10 15 20 25 30 of variation in y is explained by the least-squares model? (Round your answer to one decimal place.) (d) In a week during which Dorothy makes 23 visits, how many people do you predict will buy insurance from her? (Round your answer to one decimal place.) people

MATLAB: An Introduction with Applications
6th Edition
ISBN:9781119256830
Author:Amos Gilat
Publisher:Amos Gilat
Chapter1: Starting With Matlab
Section: Chapter Questions
Problem 1P

Related questions
Question
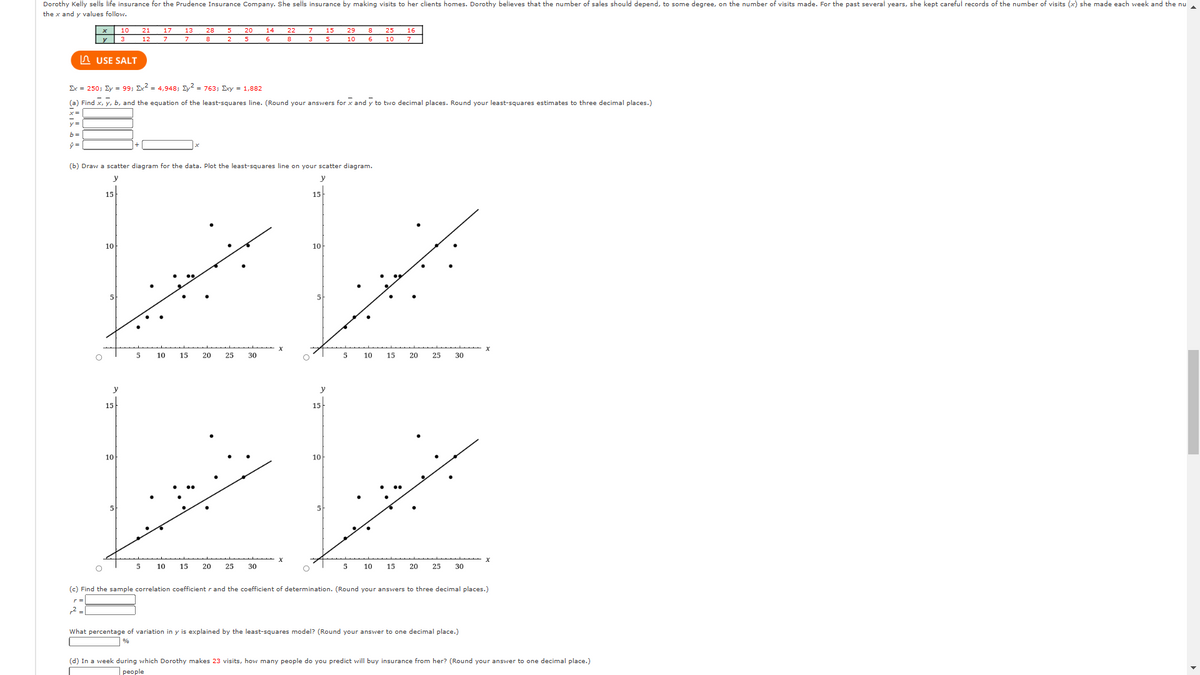
Transcribed Image Text:Dorothy Kelly sells life insurance for the Prudence Insurance Company. She sells insurance by making visits to her clients homes. Dorothy believes that the number of sales should depend, to some degree, on the number of visits made. For the past several years, she kept careful records of the number of visits (x) she made each week and the nu
the x and y values follow.
O
ý=
y
USE SALT
2 =
O
O
15
Σx = 250; Σy = 99; Σx2 = 4,948; Σy2 = 763; Σxy = 1,882
(a) Find x, y, b, and the equation of the least-squares line. (Round your answers for x and y to two decimal places. Round your least-squares estimates to three decimal places.)
10
10
3
y
15
(b) Draw a scatter diagram for the data. Plot the least-squares line on your scatter diagram.
y
y
10
21 17
12
5
5
13
7
10
10
28 5
8
2
15
15
20
20 14
6
20
25
22 7
8
3
30
25 30
15
5
O
29 8 25 16
10 6 10
10
Ex
15
10
5 10
5
10
15 20
15 20
25 30
25
30
(c) Find the sample correlation coefficient r and the coefficient of determination. (Round your answers to three decimal places.)
What percentage of variation in y is explained by the least-squares model? (Round your answer to one decimal place.)
%
(d) In a week during which Dorothy makes 23 visits, how many people do you predict will buy insurance from her? (Round your answer to one decimal place.)
people
Expert Solution
This question has been solved!
Explore an expertly crafted, step-by-step solution for a thorough understanding of key concepts.

Step by step
Solved in 6 steps with 1 images

Recommended textbooks for you
MATLAB: An Introduction with Applications
Statistics
ISBN:
9781119256830
Author:
Amos Gilat
Publisher:
John Wiley & Sons Inc

Probability and Statistics for Engineering and th…
Statistics
ISBN:
9781305251809
Author:
Jay L. Devore
Publisher:
Cengage Learning

Statistics for The Behavioral Sciences (MindTap C…
Statistics
ISBN:
9781305504912
Author:
Frederick J Gravetter, Larry B. Wallnau
Publisher:
Cengage Learning
MATLAB: An Introduction with Applications
Statistics
ISBN:
9781119256830
Author:
Amos Gilat
Publisher:
John Wiley & Sons Inc
Probability and Statistics for Engineering and th…
Statistics
ISBN:
9781305251809
Author:
Jay L. Devore
Publisher:
Cengage Learning
Statistics for The Behavioral Sciences (MindTap C…
Statistics
ISBN:
9781305504912
Author:
Frederick J Gravetter, Larry B. Wallnau
Publisher:
Cengage Learning

Elementary Statistics: Picturing the World (7th E…
Statistics
ISBN:
9780134683416
Author:
Ron Larson, Betsy Farber
Publisher:
PEARSON

The Basic Practice of Statistics
Statistics
ISBN:
9781319042578
Author:
David S. Moore, William I. Notz, Michael A. Fligner
Publisher:
W. H. Freeman

Introduction to the Practice of Statistics
Statistics
ISBN:
9781319013387
Author:
David S. Moore, George P. McCabe, Bruce A. Craig
Publisher:
W. H. Freeman