Danny owns a small business and he is trying to compare the number of phone calls that have been made over the previous six months to prospective clients to the total number of sales that have been made. How should he set up a graph to visualize the relationship? O He should label the y-axis with the number of calls made each week and the x-axis with the number of sales each week. O He should label the x-axis with the number of calls made each week and the y-axis with the number of sales each week. O He should label the x-axis as the number of calls from the last year and the y-axis as the number of sales. O He will realize that he cannot graph this relationship because both variables are independent of each other.
Danny owns a small business and he is trying to compare the number of phone calls that have been made over the previous six months to prospective clients to the total number of sales that have been made. How should he set up a graph to visualize the relationship? O He should label the y-axis with the number of calls made each week and the x-axis with the number of sales each week. O He should label the x-axis with the number of calls made each week and the y-axis with the number of sales each week. O He should label the x-axis as the number of calls from the last year and the y-axis as the number of sales. O He will realize that he cannot graph this relationship because both variables are independent of each other.

Glencoe Algebra 1, Student Edition, 9780079039897, 0079039898, 2018
18th Edition
ISBN:9780079039897
Author:Carter
Publisher:Carter
Chapter1: Expressions And Functions
Section1.8: Interpreting Graphs Of Functions
Problem 4CYU

Related questions
Topic Video
Question
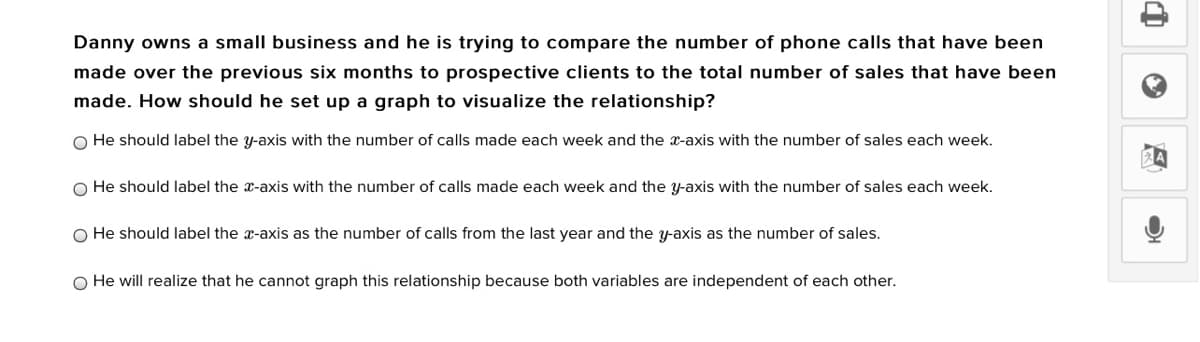
Transcribed Image Text:Danny owns a small business and he is trying to compare the number of phone calls that have been
made over the previous six months to prospective clients to the total number of sales that have been
made. How should he set up a graph to visualize the relationship?
O He should label the y-axis with the number of calls made each week and the x-axis with the number of sales each week.
O He should label the x-axis with the number of calls made each week and the y-axis with the number of sales each week.
O He should label the x-axis as the number of calls from the last year and the y-axis as the number of sales.
O He will realize that he cannot graph this relationship because both variables are independent of each other.
Expert Solution
This question has been solved!
Explore an expertly crafted, step-by-step solution for a thorough understanding of key concepts.

This is a popular solution!

Trending now
This is a popular solution!

Step by step
Solved in 2 steps

Knowledge Booster


Learn more about
Need a deep-dive on the concept behind this application? Look no further. Learn more about this topic, algebra and related others by exploring similar questions and additional content below.Recommended textbooks for you
Glencoe Algebra 1, Student Edition, 9780079039897…
Algebra
ISBN:
9780079039897
Author:
Carter
Publisher:
McGraw Hill

Algebra for College Students
Algebra
ISBN:
9781285195780
Author:
Jerome E. Kaufmann, Karen L. Schwitters
Publisher:
Cengage Learning

College Algebra (MindTap Course List)
Algebra
ISBN:
9781305652231
Author:
R. David Gustafson, Jeff Hughes
Publisher:
Cengage Learning
Glencoe Algebra 1, Student Edition, 9780079039897…
Algebra
ISBN:
9780079039897
Author:
Carter
Publisher:
McGraw Hill
Algebra for College Students
Algebra
ISBN:
9781285195780
Author:
Jerome E. Kaufmann, Karen L. Schwitters
Publisher:
Cengage Learning
College Algebra (MindTap Course List)
Algebra
ISBN:
9781305652231
Author:
R. David Gustafson, Jeff Hughes
Publisher:
Cengage Learning

Intermediate Algebra
Algebra
ISBN:
9781285195728
Author:
Jerome E. Kaufmann, Karen L. Schwitters
Publisher:
Cengage Learning

Big Ideas Math A Bridge To Success Algebra 1: Stu…
Algebra
ISBN:
9781680331141
Author:
HOUGHTON MIFFLIN HARCOURT
Publisher:
Houghton Mifflin Harcourt

Algebra & Trigonometry with Analytic Geometry
Algebra
ISBN:
9781133382119
Author:
Swokowski
Publisher:
Cengage